Safeway 2011 Annual Report Download - page 2
Download and view the complete annual report
Please find page 2 of the 2011 Safeway annual report below. You can navigate through the pages in the report by either clicking on the pages listed below, or by using the keyword search tool below to find specific information within the annual report.-
 1
1 -
 2
2 -
 3
3 -
 4
4 -
 5
5 -
 6
6 -
 7
7 -
 8
8 -
 9
9 -
 10
10 -
 11
11 -
 12
12 -
 13
13 -
14
-
15
-
16
-
17
-
18
-
19
-
20
-
21
-
22
-
23
-
24
-
25
-
26
-
27
-
28
-
29
-
30
-
31
-
32
-
33
-
34
-
35
-
36
-
37
-
38
-
39
-
40
-
41
-
42
-
43
-
44
-
45
-
46
-
47
-
48
-
49
-
50
-
51
-
52
-
53
-
54
-
55
-
56
-
57
-
58
-
59
-
60
-
61
-
62
-
63
-
64
-
65
-
66
-
67
-
68
-
69
-
70
-
71
-
72
-
73
-
74
-
75
-
76
-
77
-
78
-
79
-
80
-
81
-
82
-
83
-
84
-
85
-
86
-
87
-
88
-
89
-
90
-
91
-
92
-
93
-
94
-
95
-
96
-
97
-
98
-
99
-
100
-
101
-
102
-
103
-
104
-
105
-
106
-
107
-
108
 |
 |

MANUFACTURING AND
FOOD PROCESSING FACILITIES
Year-end 2011 U.S.
Canada
Milk Plants 6 3
Bakery Plants 6 2
Ice Cream Plants 2 2
Cheese & Meat Packing Plants – 1
Soft Drink Bottling Plants 4 –
Fruit & Vegetable
Processing Plants 1 3
Cake Commissary 1 –
Sandwich Commissary – 1
TOTAL 20 12
PERCENTAGE OF
STORES WITH SPECIALTY
DEPARTMENTS AND
FUEL STATIONS
Year-end 2011
Specialty Departments
Deli
99%
Floral
97%
Bakery
96%
Pharmacy
78%
Starbucks
70%
Fuel Stations
24%
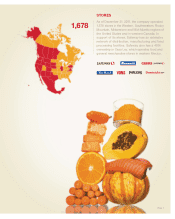
Canada
Alberta 96
Vancouver 75
Winnipeg 54
Subtotal 225
1,678
STORE COUNTS
Year-end 2011
U.S.
Denver 137
Dominick’s 76
Eastern 155
NorCal 268
Phoenix 116
Portland 114
Randalls 111
Seattle 199
Vons 277
Subtotal 1,453
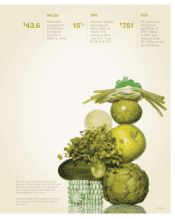
TOTAL ’04 ’05 ’06 ’07 ’08 ’09 ’10 ’11
85%
8%
26%
43%
59%
73% 79%
87%
% LIFESTYLE STORES