Ross 2011 Annual Report Download - page 4
Download and view the complete annual report
Please find page 4 of the 2011 Ross annual report below. You can navigate through the pages in the report by either clicking on the pages listed below, or by using the keyword search tool below to find specific information within the annual report.-
 1
1 -
 2
2 -
 3
3 -
 4
4 -
 5
5 -
 6
6 -
 7
7 -
 8
8 -
 9
9 -
 10
10 -
 11
11 -
 12
12 -
 13
13 -
 14
14 -
 15
15 -
16
-
17
-
18
-
19
-
20
-
21
-
22
-
23
-
24
-
25
-
26
-
27
-
28
-
29
-
30
-
31
-
32
-
33
-
34
-
35
-
36
-
37
-
38
-
39
-
40
-
41
-
42
-
43
-
44
-
45
-
46
-
47
-
48
-
49
-
50
-
51
-
52
-
53
-
54
-
55
-
56
-
57
-
58
-
59
-
60
-
61
-
62
-
63
-
64
-
65
-
66
-
67
-
68
-
69
-
70
-
71
-
72
-
73
-
74
-
75
 |
 |

2
Our continued focus on delivering more stores,
more brands, and more bargains was the primary
driver of our robust sales and earnings growth
in 2011. This strong financial performance also
reflects our ongoing ability to execute our off-price
strategies across all areas of the business, with a
commitment to offering exceptional values every
day to our customers.
2011 EPS Up 24% on Top of a 31%
Gain in 2010
We achieved another year of record results in
2011, which was especially noteworthy on top of
outstanding multi-year gains. For the 52 weeks
ended January 28, 2012, sales increased 9% to
$8.6 billion, with same store sales up 5% on top of
5% and 6% gains in the prior two years.
Net earnings for the year grew 18% to $657.2
million, up from $554.8 million in 2010. Earnings
per share rose to $2.86, compared to a split-
adjusted $2.31 in the prior year. This represented
a 24% gain on top of 31% and 52% increases in
fiscal 2010 and 2009, respectively.
Operating margin in 2011 grew to a record 12.4%,
up 85 basis points on top of 140 and 250 basis
point gains in the prior two years. The main drivers
of this significant improvement in profitability were
higher merchandise gross margin and leverage on
operating expenses from our strong sales gains.
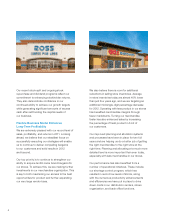
Expansion into New Markets
Accelerated Store Growth
As planned, net unit growth increased to 7% in
2011, up from 5% in the prior year. This expansion
included 70 net new stores, consisting of 49
Ross Dress for Less and 21 dd’s DISCOUNTS
locations. We ended the year with a combined
total of 1,125 locations in 29 states, the District of
Columbia, and Guam.
We made our initial entry into the Midwest region
in October 2011, with 12 new Ross Dress for
Less stores opening in the greater Chicago area.
We are excited about the long-term growth
opportunities in Chicago and other Midwest
markets, based on their healthy population
densities and favorable demographics that are
in line with our target customer.
dd’s DISCOUNTS also entered a number of new
markets in 2011, including Houston, San Diego,
and the District of Columbia, as well as Jacksonville
and Fort Myers, Florida.
For 2012, we are planning similar percentage unit
growth and expect to open about 80 additional
locations. This expansion will include approximately
60 Ross Dress for Less and 20 dd’s DISCOUNTS
stores, with about one-third of these openings
targeted for new markets.
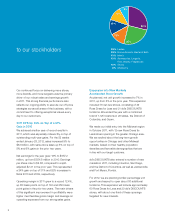
to our stockholders
29%
25%
8%
12%
13%
13%
29% Ladies
25% Home Accents, Bed and Bath
13% Men’s
13% Accessories, Lingerie,
Fine Jewelry, Fragrances
12% Shoes
8% Children’s