Ricoh 2004 Annual Report Download - page 5
Download and view the complete annual report
Please find page 5 of the 2004 Ricoh annual report below. You can navigate through the pages in the report by either clicking on the pages listed below, or by using the keyword search tool below to find specific information within the annual report.-
 1
1 -
 2
2 -
 3
3 -
 4
4 -
 5
5 -
 6
6 -
 7
7 -
 8
8 -
 9
9 -
 10
10 -
 11
11 -
 12
12 -
 13
13 -
 14
14 -
 15
15 -
 16
16 -
17
-
18
-
19
-
20
-
21
-
22
-
23
-
24
-
25
-
26
-
27
-
28
-
29
-
30
-
31
-
32
-
33
-
34
-
35
-
36
-
37
-
38
-
39
-
40
-
41
-
42
-
43
-
44
-
45
-
46
-
47
-
48
-
49
-
50
-
51
-
52
-
53
-
54
-
55
-
56
-
57
-
58
-
59
-
60
 |
 |

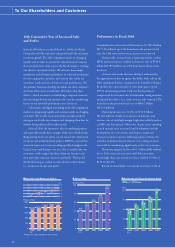
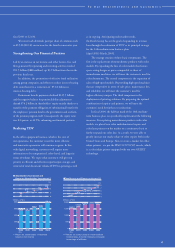
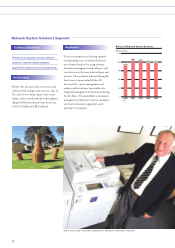
Shareholders' Investment and
Return on Shareholders' Investment**
(%) (%)
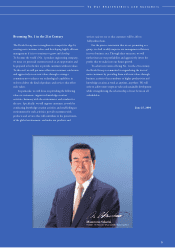
To Our Shareholders and Customers
fiscal 2003 to 12.6%.
We raised cash dividends paid per share of common stock
to ¥15.00 ($0.14), an increase for the fourth consecutive year.
Strengthening Our Financial Position
Led by an increase in net income and other factors, free cash
flow generated by operating and investing activities totaled
¥91.5 billion ($880 million), up ¥3.9 billion from that in the
previous fiscal year.
In addition, the promotion of effective fund utilization
among group companies and efforts to reduce interest-bearing
debt contributed to a reduction of ¥51.8 billion in
interest-bearing debt.
Retirement benefit payments declined ¥125.5 billion,
and the negative balance for pension liability adjustments
shrunk ¥74.2 billion in shareholders’ equity mainly thanks to a
transfer of the payment obligation of substitutional benefits for
the employees’ pension fund to the government and a reform
of the pension program itself. Consequently, the equity ratio
rose 8.0 points, to 42.9%, enhancing our financial position.
Realizing TDV
In the office equipment business, which is the core of
our operations, the customer’s need for more efficient
and innovative operations will continue to grow. In line
with digital networking, customers will require more
information to be computerized, color-based, and larger in
terms of volume. We expect that customers will give top
priority to efficient and effective input/output, storage, and
retrieval of total document volume (TDV) in printing as well
as in copying. Anticipating such market trends,
the Ricoh Group has set the goal of expanding its revenue
base through the realization of TDV as its principal strategy
for the 14th medium-term business plan
(April 2002–March 2005).
The strategy consists of three basic components. The
first is the replacement of monochrome products with color
models. By expanding the line of color models that feature
space-saving designs at prices comparable to those of
monochrome machines, we will meet the customer’s need for
color documents. The second component is the expansion of
sales of high-speed models. By providing high-speed machines
that are competitive in terms of sales price, maintenance fees,
and reliability, we will meet the customer’s need for
higher-efficiency output. The third component is the
deployment of printing solutions. By proposing the optimal
combination of copiers and printers, we will meet the
customer’s need for further cost reductions.
In fiscal 2004, the halfway mark of the 14th medium-
term business plan, we specifically implemented the following
measures. For replacing monochrome products with color
models, we placed new color multifunctional copiers and
color laser printers on the market on a continuous basis to
further expand our color line. As a result, we were able to
greatly increase our market share of color copiers both in the
United States and Europe. Also, to create a market for office
inkjet printers, we put the IPSiO G707/G505 on sale, which
is a color inkjet printer equipped with our own GELJET
technology.
4
(Billions of Yen) (Billions of Yen)
0
200
400
600
800
2001
556.7
2002
633.0
2003
657.5
2004
795.1
6
9
12
15
(FY)
2000
541.5
8.1
9.7
10.4
11.2 12.6
6.0
4.4
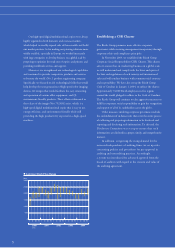
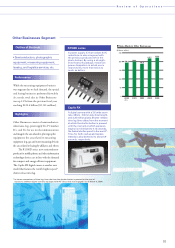
Total Assets and Return on Assets***
0
500
1,000
1,500
2,000
2000
(FY)
1,543.3
4
5
6
7
8
2001
1,704.7
2002
1,832.9
2003
1,884.9
2004
1,852.7
6.4 6.6
7. 7
**Return on shareholders' investment
based on net income
***Return on assets based on income before
income taxes, minority interests and equity
in earnings of affiliates