Redbox 2001 Annual Report Download - page 3
Download and view the complete annual report
Please find page 3 of the 2001 Redbox annual report below. You can navigate through the pages in the report by either clicking on the pages listed below, or by using the keyword search tool below to find specific information within the annual report.-
 1
1 -
 2
2 -
 3
3 -
 4
4 -
 5
5 -
 6
6 -
 7
7 -
 8
8 -
 9
9 -
 10
10 -
 11
11 -
 12
12
 |
 |

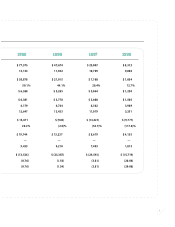
9,327
1996 1997 1998 1999 2000 2001
$15.7
$22.5
$37.3
-$13.4
-$9.8 -$0.9
-15
-10
-5
0
5
10
15
20
25
30
35
40
1996 1997 1998 1999 2000 2001
EBITDA (dollars in millions)
1,501
3,204
4,813
6,943
8,482
0
2,000
4,000
6,000
8,000
10,000
Installed Units
$25.0
$8.3
$47.7
$77.6
$102.2
$127.8
0
20
40
60
80
100
120
140
1996 1997 1998 1999 2000 2001
Revenue (dollars in millions)
0
10
20
30
40
50
60
70
80
*Revenue less direct expenses
Direct Contribution* (dollars in millions)Direct Contribution* (dollars in millions)
$1.1 $7.1
$21.0
$38.9
$54.3
$71.2
1996 1997 1998 1999 2000 2001
* EBITDA - capex - net interest expense
-$26.1
-$33.3
-$50.7
-$32.4 -$6.2
$15.3
-50
-40
-30
-20
-10
0
10
20
1996 1997 1998 1999 2000 2001
Free Cash Flow* (dollars in millions)
Net Income (dollars in millions)
-$13.5
-$23.4
-$29.6
-$15.7 -$8.1
$4.2
-30
-20
-10
0
10
1996 1997 1998 1999 2000 2001
1
financial highlights
North American Core Business
The following financial information
represents the results of the North
American core business only.
Consolidated financial information
prepared in accordance with
accounting principles generally
accepted in the United States of
America (GAAP) is presented in the
enclosed Annual Report on Form 10-K.
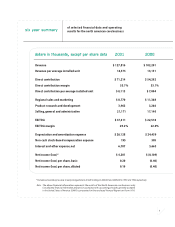
2001 2000 2001/2000
Percent Change
(dollars in millions, except per share data)
$127.8 $102.2 25.1%
71.2 54.3 31.2
37.3 22.5 65.7
11.0 (2.4)
—
4.2 (8.1)
—
—
$0.19 $(0.40)
21,844 20,271 7.8
Revenue
Direct contribution
EBITDA*
Operating income (loss)
Net income (loss)
Net income (loss) per diluted share
Weighted shares outstanding (000)
*Earnings before interest, taxes, depreciation and amortization, and non-cash stock-based compensation