Redbox 2000 Annual Report Download - page 8
Download and view the complete annual report
Please find page 8 of the 2000 Redbox annual report below. You can navigate through the pages in the report by either clicking on the pages listed below, or by using the keyword search tool below to find specific information within the annual report.-
 1
1 -
 2
2 -
 3
3 -
 4
4 -
 5
5 -
 6
6 -
 7
7 -
 8
8 -
 9
9 -
 10
10 -
 11
11 -
 12
12
 |
 |

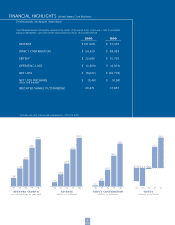
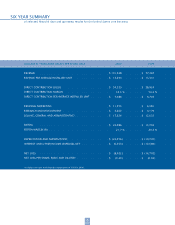
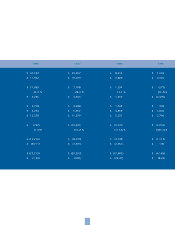
SIX YEAR SUMMARY
$ 101,928
$ 13,294
$ 54,329
53.3 %
$ 7,086
$ 11,355
$ 3,262
$ 17,626
$ 22,086
21.7 %
$ (24,456)
$ (5,653)
$ (8,022)
$ (0.40)
REVENUE
REVENUE PER AVERAGE INSTALLED UNIT
DIRECT CONTRIBUTION (LOSS)
DIRECT CONTRIBUTION MARGIN
DIRECT CONTRIBUTION PER AVERAGE INSTALLED UNIT
REGIONAL MARKETING
RESEARCH AND DEVELOPMENT
SELLING, GENERAL AND ADMINISTRATIVE*
EBITDA
EBITDA MARGIN (%)
DEPRECIATION AND AMORTIZATION
INTEREST AND OTHER INCOME (EXPENSE), NET
NET LOSS
NET LOSS PER SHARE, BASIC AND DILUTED
2000 1999
of selected financial data and operating results for the United States core business
6
DOLLARS IN THOUSANDS EXCEPT PER SHARE DATA
$ 77,467
$ 13,341
$ 38,924
50.2 %
$ 6,703
$ 6,381
$ 4,179
$ 12,632
$ 15,732
20.3 %
$ (19,745)
$ (12,689)
$ (16,703)
$ (0.94)
*Includes non-cash stock-based compensation of $505 in 2000.