Rayovac 2010 Annual Report Download - page 7
Download and view the complete annual report
Please find page 7 of the 2010 Rayovac annual report below. You can navigate through the pages in the report by either clicking on the pages listed below, or by using the keyword search tool below to find specific information within the annual report.-
 1
1 -
 2
2 -
 3
3 -
 4
4 -
 5
5 -
 6
6 -
 7
7 -
 8
8 -
 9
9 -
 10
10 -
 11
11 -
 12
12 -
 13
13 -
 14
14 -
 15
15 -
 16
16 -
 17
17 -
 18
18 -
19
-
20
-
21
-
22
-
23
-
24
-
25
-
26
-
27
-
28
-
29
-
30
-
31
-
32
-
33
-
34
-
35
-
36
-
37
-
38
-
39
-
40
-
41
-
42
-
43
-
44
-
45
-
46
-
47
-
48
-
49
-
50
-
51
-
52
-
53
-
54
-
55
-
56
-
57
-
58
-
59
-
60
-
61
-
62
-
63
-
64
-
65
-
66
-
67
-
68
-
69
-
70
-
71
-
72
-
73
-
74
-
75
-
76
-
77
-
78
-
79
-
80
-
81
-
82
-
83
-
84
-
85
-
86
-
87
-
88
-
89
-
90
-
91
-
92
-
93
-
94
-
95
-
96
-
97
-
98
-
99
-
100
-
101
-
102
-
103
-
104
-
105
-
106
-
107
-
108
-
109
-
110
-
111
-
112
-
113
-
114
-
115
-
116
-
117
-
118
-
119
-
120
-
121
-
122
-
123
-
124
-
125
-
126
-
127
-
128
-
129
-
130
-
131
-
132
-
133
-
134
-
135
-
136
-
137
-
138
-
139
-
140
-
141
-
142
-
143
-
144
-
145
-
146
-
147
-
148
-
149
-
150
-
151
-
152
-
153
-
154
-
155
-
156
-
157
-
158
-
159
-
160
-
161
-
162
-
163
-
164
-
165
-
166
-
167
-
168
-
169
-
170
-
171
-
172
-
173
-
174
-
175
-
176
-
177
-
178
-
179
-
180
-
181
-
182
-
183
-
184
-
185
-
186
-
187
-
188
-
189
-
190
 |
 |

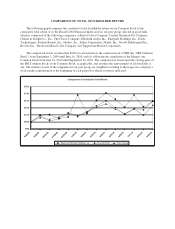
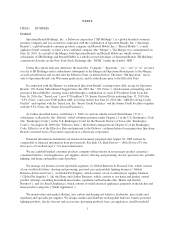
COMPARISON OF TOTAL STOCKHOLDER RETURN
The following graph compares the cumulative total stockholder return on our Common Stock to the
cumulative total return of (i) the Russell 2000 Financial Index and (ii) our peer group selected in good faith,
which is composed of the following companies: Alberto-Culver Company, Central Garden & Pet Company,
Church & Dwight Co., Inc., The Clorox Company, Elizabeth Arden, Inc., Energizer Holdings, Inc., Exide
Technologies, Fortune Brands, Inc., Hasbro, Inc., Jarden Corporation, Mattel, Inc., Newell Rubbermaid Inc.,
Revlon, Inc., The Scotts Miracle-Gro Company and Tupperware Brands Corporation.
The comparison below assumes that $100 was invested in (i) the common stock of SBI (the “SBI Common
Stock”) from September 2, 2009 until June 16, 2010, and (ii) following the completion of the Merger, our
Common Stock from June 16, 2010 until September 30, 2010. The comparison is based upon the closing price of
the SBI Common Stock or our Common Stock, as applicable, and assumes the reinvestment of all dividends, if
any. The returns of each of the companies in our peer group are weighted according to the respective company’s
stock market capitalization at the beginning of each period for which a return is indicated.
Comparison of Cumulative Total Return
$90
$100
$110
$120
$130
$140
$150
9/02/09
9/30/09
10/31/09
11/30/09
12/31/09
1/31/10
2/28/10
3/31/10
4/30/10
5/31/10
6/30/10
7/31/10
8/31/10
9/30/10
Spectrum Brands Holdings, Inc. Russell 2000 Peer Group