Quest Diagnostics 2001 Annual Report Download - page 3
Download and view the complete annual report
Please find page 3 of the 2001 Quest Diagnostics annual report below. You can navigate through the pages in the report by either clicking on the pages listed below, or by using the keyword search tool below to find specific information within the annual report.-
 1
1 -
 2
2 -
 3
3 -
 4
4 -
 5
5 -
 6
6 -
 7
7 -
 8
8 -
 9
9 -
 10
10 -
 11
11 -
 12
12 -
 13
13 -
 14
14 -
15
-
16
-
17
-
18
-
19
-
20
 |
 |

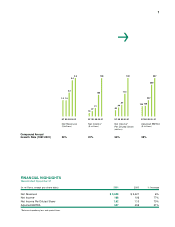
97 98 99 00 01
Net Revenues
($ billions)
1.5 1.5
2.2
3.4 3.6
FINANCIAL HIGHLIGHTS
Years Ended December 31
(in millions, except per share data) 2001 2000 % Increase
Net Revenues $ 3,628 $ 3,421 6%
Net Income*188 106 77%
Net Income Per Diluted Share*1.92 1.13 70%
Adjusted EBITDA ,557 459 21%
* Before extraordinary loss and special items
1
97 98 99 00 01
Net Income*
($ millions)
18 27
41
106
188
97 98 99 00 01
Adjusted EBITDA
($ millions)
154 159
237
459
557
Compound Annual
Growth Rate (1997-2001) 24% 81% 59% 38%
97 98 99 00 01
Net Income*
Per Diluted Share
(dollars)
.30 .44 .57
1.13
1.92