Proctor and Gamble 2013 Annual Report Download - page 37
Download and view the complete annual report
Please find page 37 of the 2013 Proctor and Gamble annual report below. You can navigate through the pages in the report by either clicking on the pages listed below, or by using the keyword search tool below to find specific information within the annual report.-
 1
1 -
2
-
3
-
4
-
5
-
6
-
7
-
8
-
9
-
10
-
11
-
12
-
13
-
14
-
15
-
16
-
17
-
18
-
19
-
20
-
21
-
22
-
23
-
24
-
25
-
26
-
 27
27 -
 28
28 -
 29
29 -
 30
30 -
 31
31 -
 32
32 -
 33
33 -
 34
34 -
 35
35 -
 36
36 -
 37
37 -
 38
38 -
 39
39 -
 40
40 -
 41
41 -
 42
42 -
 43
43 -
 44
44 -
 45
45 -
 46
46 -
 47
47 -
48
-
49
-
50
-
51
-
52
-
53
-
54
-
55
-
56
-
57
-
58
-
59
-
60
-
61
-
62
-
63
-
64
-
65
-
66
-
67
-
68
-
69
-
70
-
71
-
72
-
73
-
74
-
75
-
76
-
77
-
78
-
79
-
80
-
81
-
82
-
83
-
84
-
85
-
86
-
87
-
88
-
89
-
90
-
91
-
92
 |
 |

The Procter & Gamble Company 35
pricing in North America. Global market share of the home
care category was unchanged. Batteries volume increased
low single digits due to a mid-single-digit increase in
developing regions from market growth and geographic
expansion, partially offset by a low single-digit decrease in
developed markets due to market contraction and share
losses, primarily behind higher pricing in Western Europe to
improve the margin structure. Global market share of the
batteries category was unchanged. Pet Care volume
decreased mid-single digits due to competitive activity and
the impact of product recalls for Natura in developed
markets. Volume was in line with the prior year in
developing regions. Global market share of the pet care
category was down less than half a point.
Net earnings increased 7% to $3.1 billion due to a 70-basis
point increase in net earnings margin and the increase in net
sales. Net earnings margin increased mainly due to gross
margin expansion. Gross margin increased due to higher
pricing and manufacturing cost savings, partially offset by
higher commodity costs and the impact from product recalls
on the Natura brand. SG&A as a percentage of net sales was
nearly unchanged, as increased marketing spending was
largely offset by reduced overhead costs.
Fiscal year 2012 compared with fiscal year 2011
Fabric Care and Home Care net sales increased 3% to $27.3
billion in 2012. Unit volume decreased 1%. Organic sales
were up 3%. Price increases contributed 5% to net sales
growth. Mix negatively impacted net sales growth by 1%
due to disproportionate growth of mid-tier product lines and
developing regions, which have lower than segment average
selling prices. Global market share of the Fabric Care and
Home Care segment decreased 0.3 points. Volume in
developing regions grew mid-single digits, while volume in
developed regions decreased mid-single digits. Fabric Care
volume decreased low single digits mainly due to the impact
of price increases in North America, partially offset by
growth in Asia. Global market share of the fabric care
category decreased half a point. Home Care volume
increased low single digits driven by initiative activity and
distribution expansion in developing regions, partially offset
by a low single-digit decline in developed regions due to the
impact of price increases. Global market share of the home
care category was unchanged. Batteries volume decreased
low single digits due to market contraction and distribution
losses in developed markets, partially offset by market
growth and distribution expansion in developing regions.
Global market share of the batteries category increased
about half a point. Pet Care volume decreased high single
digits due mainly to market contraction and customer
inventory reductions. Global market share of the pet care
category was down about half a point.
Net earnings decreased 6% to $2.9 billion as net sales
growth was more than offset by a 100-basis point decrease
in net earnings margin. Net earnings margin decreased
primarily due to gross margin contraction. Gross margin
decreased mainly due to higher commodity costs and
unfavorable product and geographic mix, partially offset by
manufacturing cost savings and higher pricing. SG&A as a
percentage of net sales decreased nominally as higher
marketing costs were largely offset by overhead scale
leverage from increased sales.
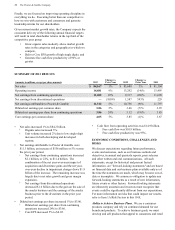
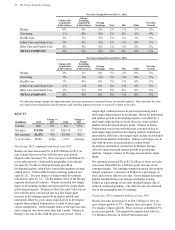
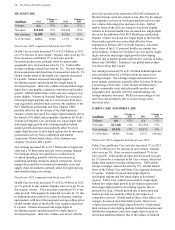
BABY CARE AND FAMILY CARE
($ millions) 2013
Change vs
2012 2012
Change vs
2011
Volume n/a +4% n/a +1%
Net sales $16,790 +2% $16,493 +6%
Net earnings $2,242 +6% $2,123 +7%
% of Net Sales 13.4% 50 bps 12.9% 20 bps
Fiscal year 2013 compared with fiscal year 2012
Baby Care and Family Care net sales increased 2% to $16.8
billion in 2013 on 4% volume growth. Organic sales were
up 4%. Pricing added 1% to net sales growth. Product mix
reduced net sales by 1% due to disproportionate growth of
Family Care, which has lower than segment average selling
prices. Unfavorable foreign exchange reduced net sales by
2%. Global market share of the Baby Care and Family Care
segment decreased 0.3 points. Volume increased mid-single
digits in developing regions and low single digits in
developed regions. Volume in Baby Care increased low
single digits as a mid-single-digit increase in developing
regions from market growth, distribution expansion and
innovation, was partially offset by a low single-digit
decrease in developed regions due to market contraction and
competitive promotional activity, primarily in Western
Europe. Global market share of the baby care category
decreased nearly half a point. Volume in Family Care
increased mid-single digits primarily due to market growth
and innovation on Charmin and Bounty. In the U.S., all-
outlet share of the family care category was flat.
Net earnings increased 6% to $2.2 billion due to the increase
in net sales and a 50-basis point increase in net earnings
margin. Net earnings margin increased due to gross margin
expansion. The increase in gross margin was driven by the
impact of higher pricing and manufacturing and commodity
cost savings, partially offset by unfavorable product and
geographic mix.
Fiscal year 2012 compared with fiscal year 2011
Baby Care and Family Care net sales increased 6% to $16.5
billion in 2012 on 1% volume growth. Organic sales were up
6%. Pricing added 5% to net sales growth. Global market
share of the Baby Care and Family Care segment increased
0.2 points. Volume grew double digits in developing regions
and decreased low single digits in developed regions.
Volume in Baby Care was up mid-single digits behind
market size growth and distribution expansion in developing
regions, partially offset by declines in North America and
Western Europe from diaper market contraction. Global
market share of the baby care category increased more than
half a point. Volume in Family Care decreased low single