Proctor and Gamble 2013 Annual Report Download
Download and view the complete annual report
Please find the complete 2013 Proctor and Gamble annual report below. You can navigate through the pages in the report by either clicking on the pages listed below, or by using the keyword search tool below to find specific information within the annual report.-
 1
1 -
 2
2 -
 3
3 -
 4
4 -
 5
5 -
 6
6 -
 7
7 -
 8
8 -
 9
9 -
 10
10 -
 11
11 -
 12
12 -
13
-
14
-
15
-
16
-
17
-
18
-
19
-
20
-
21
-
22
-
23
-
24
-
25
-
26
-
27
-
28
-
29
-
30
-
31
-
32
-
33
-
34
-
35
-
36
-
37
-
38
-
39
-
40
-
41
-
42
-
43
-
44
-
45
-
46
-
47
-
48
-
49
-
50
-
51
-
52
-
53
-
54
-
55
-
56
-
57
-
58
-
59
-
60
-
61
-
62
-
63
-
64
-
65
-
66
-
67
-
68
-
69
-
70
-
71
-
72
-
73
-
74
-
75
-
76
-
77
-
78
-
79
-
80
-
81
-
82
-
83
-
84
-
85
-
86
-
87
-
88
-
89
-
90
-
91
-
92
 |
 |

Annual Report
Table of contents
-
Page 1
2013 Annual Report -
Page 2
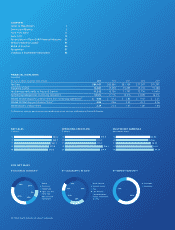
... Index Form 10-K Reconciliation of Non-GAAP Financial Measures Global Leadership Council Board of Directors Recognition Company & Shareholder Information 1 5 11 12 85 86 86 87 88 FINANCIAL HIGHLIGHTS (unaudited) Amounts in millions, except per share amounts 2013 2012 2011 2010 2009 Net Sales... -
Page 3
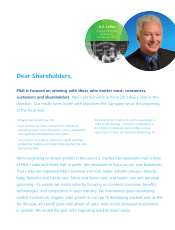
... care; and health care and personal grooming - to ensure we create value by focusing on common consumer benefits, technologies, and competitors in each industry. We maintained good developing market momentum. Organic sales growth in our top 10 developing markets was up 8% for the year, and profit... -
Page 4
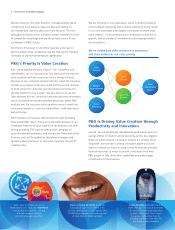
... shareholder return. This goal is important because it's an integrated measure of value creation at the business unit level. Strong operating TSR requires sales growth, progress on gross and operating margins, and strong cash flow productivity. Business units will be guided by disciplined strategies... -
Page 5
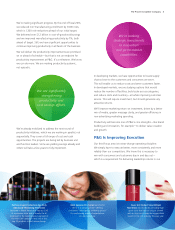
... options that would reduce the number of facilities, build scale across categories, and reduce costs and inventory - all while improving customer service. This will require investment, but should generate very attractive returns. We'll improve marketing return on investment, driven by a better mix... -
Page 6
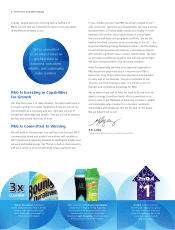
... we need to change to perform better. We're committed to do what it takes to get P&G back to balanced, consistent, reliable, and sustainable value creation for consumers, customers, shareholders and employees. We are focused on the future. We are determined to win. P&G Is Investing in Capabilities... -
Page 7
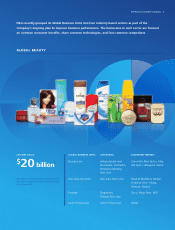
... Company's ongoing plan to improve business performance. The businesses in each sector are focused on common consumer benefits, share common technologies, and face common competitors. global beauty 2013 NET SALES GLOBAL BUSINESS UNITS CATEGORIES LEADERSHIP BRANDS $ 20 billion * Beauty Care... -
Page 8
... 2013 NET SALES GLOBAL BUSINESS UNITS CATEGORIES LEADERSHIP BRANDS $ 22 billion * Baby Care Baby Wipes, Diapers, Pants Paper Towels, Tissues, Toilet Paper Feminine Care, Incontinence Luvs, Pampers Family Care Bounty, Charmin, Puffs *This reflects an estimate. Our historical financial... -
Page 9
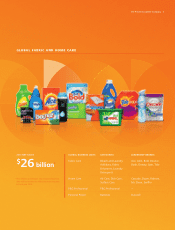
The Procter & Gamble Company 7 global fabric and home care 2013 NET SALES GLOBAL BUSINESS UNITS CATEGORIES LEADERSHIP BRANDS $ 26 billion * Fabric Care Bleach and Laundry Additives, Fabric Enhancers, Laundry Detergents Air Care, Dish Care, Surface Care P&G Professional Batteries Ace, ... -
Page 10
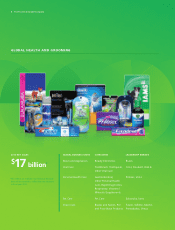
...The Procter & Gamble Company global health and grooming 2013 NET SALES GLOBAL BUSINESS UNITS CATEGORIES LEADERSHIP BRANDS $ 17 billion * Braun and Appliances Oral Care Beauty Electronics Toothbrush, Toothpaste, Other Oral Care Gastrointestinal, Other Personal Health Care, Rapid Diagnostics... -
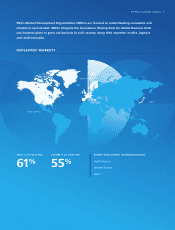
Page 11
... from the Global Business Units into business plans to grow our business in each country, using their expertise in sales, logistics and retail execution. developed markets Western Europe Japan North America SALES % OF TOTAL P&G VOLUME % OF TOTAL P&G MARKET DEVELOPMENT ORGANIZATION (MDO) 61... -
Page 12
10 The Procter & Gamble Company developing markets Central & Eastern Europe Middle East Latin America Africa Asia SALES % OF TOTAL P&G VOLUME % OF TOTAL P&G MARKET DEVELOPMENT ORGANIZATION (MDO) 39 % 45 % Asia (excluding Japan) Central & Eastern Europe, Middle East & Africa Latin America -
Page 13
... Balance Sheets Management's Discussion and Analysis of Financial Condition and Results of Operations 22 23 44 Management's Reports and Reports of Independent Registered Public Accounting Firm Consolidated Statements of Comprehensive Income Consolidated Statements of Shareholders' Equity... -
Page 14
... & Gamble Plaza, Cincinnati, Ohio 45202 Telephone (513) 983-1100 IRS Employer Identification No. 31-0411980 State of Incorporation: Ohio Securities registered pursuant to Section 12(b) of the Act: Title of each class Common Stock, without Par Value Name of each exchange on which registered New York... -
Page 15
... Canton, MA 02021. Financial Information about Segments As of June 30, 2013, the Company has five reportable segments under U.S. GAAP: Beauty; Grooming; Health Care; Fabric Care and Home Care; and Baby Care and Family Care. Many of the factors necessary for understanding these businesses are similar... -
Page 16
... Financial Statements. Historical numbers include employees of discontinued operations. Total Number of Employees 2013 2012 2011 2010 2009 2008 121,000 126,000 129,000 127,000 132,000 135,000 Financial Information about Foreign and Domestic Operations Net sales in the United States account... -
Page 17
...-tier value products in both developed and developing markets. To address these challenges, we must be able to successfully respond to competitive factors, including pricing, promotional incentives and trade terms. In addition, the emergence of new sales channels may affect customer and consumer... -
Page 18
... control environment processes across our diverse operations and employee base; and imposition of increased or new tariffs, quotas, trade barriers or similar restrictions on our sales outside the United States. economy; supplier, vendor or customer disruptions resulting from tighter credit markets... -
Page 19
... products, or the Company as a whole, thereby potentially hurting results. Our ability to successfully manage ongoing organizational change could impact our business results. We recently experienced a CEO transition, as well as other senior leadership changes, and we continue to execute a number... -
Page 20
...major customers are addressing local trade pressures, local law and regulation changes or financial distress. A failure of one or more key information technology systems, networks, processes, associated sites or service providers could have a material adverse impact on our business or reputation. We... -
Page 21
... Business Services and Chief Information Officer Chief Financial Officer Chief Technology Officer Global Customer Business Development Officer Chief Legal Officer and Secretary Global Human Resources Officer Global Brand Building Officer Senior Vice President & Comptroller Global Product Supply... -
Page 22
... value of shares purchased under the share repurchase plan was $6.0 billion. The share repurchase plan expired on June 30, 2013. Additional information required by this item can be found in Part III, Item 12 of this Form 10-K. Shareholder Return Performance Graphs Market and Dividend Information... -
Page 23
...broad market comparison) and the S&P 500 Consumer Staples Index (line of business comparison). The graph and table assume $100 was invested on June 30, 2008, and that all dividends were reinvested. Cumulative Value of $100 Investment, through June 30 Company Name/Index 2008 2009 2010 2011 2012 2013... -
Page 24
.... The information required by this item is incorporated by reference to Note 1 and Note 12 to our Consolidated Financial Statements. Financial Summary (Unaudited) Amounts in millions, except per share amounts 2013 2012 2011 2010 2009 2008 Net sales Gross profit Operating income Net earnings from... -
Page 25
...-reported consumption and market size data, as well as internal estimates. All market share references represent the percentage of sales in dollar terms on a constant currency basis of our products, relative to all product sales in the category and are measured on an annual basis versus the prior... -
Page 26
... Business Units Under U.S. GAAP, the GBUs are aggregated into five reportable segments: Beauty; Grooming; Health Care; Fabric Care and Home Care; and Baby Care and Family Care. The GBUs are responsible for developing overall brand strategy, new product upgrades and innovations and marketing plans... -
Page 27
... market share. We are the number one or number two baby care competitor in most of the key markets in which we compete, primarily behind Pampers, the Company's largest brand, with annual net sales of more than $10 billion. Our family care business is predominantly a North American business comprised... -
Page 28
... in everything we do. Executing better than our competitors is how we win with customers and consumers and generate leadership returns for our shareholders. Given current market growth rates, the Company expects the consistent delivery of the following annual financial targets will result in total... -
Page 29
... factors, including pricing, promotional incentives, trade terms and product initiatives. We must manage each of these factors, as well as maintain mutually beneficial relationships with our key customers, in order to effectively compete and achieve our business plans. As a company that manages... -
Page 30
... all business segments, primarily executed in prior periods to offset cost increases and devaluing developing market currencies. Foreign exchange reduced net sales by 2%. Organic sales growth was 3% driven by both volume and price increases. Fiscal year 2012 compared with fiscal year 2011 Net sales... -
Page 31
... to net sales, higher employee wages and benefit costs and increased merchandising investments. In fiscal 2013 we incurred impairment charges of $308 million ($290 million after-tax) related to the carrying value of goodwill in our Appliances business and the related Braun trade name intangible... -
Page 32
... rate will reduce future total Company reported net sales by less than 1% on a going basis. This does not impact our organic sales growth rate, which excludes the impact of foreign currency changes. Versus our existing business plans, the exchange rate change reduced our reported earnings per share... -
Page 33
... these investments are managed as integral parts of the Company's business units, they are accounted for as if they were consolidated subsidiaries for management and segment reporting purposes. This means pre-tax earnings in the business units include 100% of each pre-tax income statement component... -
Page 34
... Procter & Gamble Company Net Sales Change Drivers (2013 vs. 2012) Volume with Acquisitions & Divestitures Volume Excluding Acquisitions & Divestitures Foreign Exchange Net Sales Growth Price Mix Other Beauty Grooming Health Care Fabric Care and Home Care Baby Care and Family Care TOTAL COMPANY... -
Page 35
... geographic and product mix decreased net sales by 1% mainly due to disproportionate growth in developing markets, which have lower than segment average selling prices. Unfavorable foreign exchange decreased net sales growth by 1%. Global market share of the Grooming segment decreased 0.2 points... -
Page 36
... lower than segment average selling prices. Global market share of the Health Care segment decreased 0.1 points. Volume increased mid-single digits in developing regions and decreased low single digits in developed regions. Oral Care volume was in line with the prior year period as the expansion of... -
Page 37
... 2013 on 4% volume growth. Organic sales were up 4%. Pricing added 1% to net sales growth. Product mix reduced net sales by 1% due to disproportionate growth of Family Care, which has lower than segment average selling prices. Unfavorable foreign exchange reduced net sales by 2%. Global market share... -
Page 38
... and unfavorable geographic and product mix, partially offset by the impact of higher pricing. SG&A as a percentage of net sales decreased due to scale leverage from increased sales. CORPORATE ($ millions) 2013 Change vs 2012 2012 Change vs 2011 results and the underlying sales no longer need to... -
Page 39
...the timing and mix of sales late in the period and foreign exchange impacts. Increased inventory used $225 million of cash to support product initiatives and to build stock to support capacity expansions and manufacturing sourcing changes, partially offset by inventory management improvement efforts... -
Page 40
... from asset sales contributed $2.9 billion to cash in 2012 mainly due to the sale of our snacks business. Financing Cash Flows Dividend Payments. Our first discretionary use of cash is dividend payments. Dividends per common share increased 7% to $2.29 per share in 2013. Total dividend payments to... -
Page 41
... course of business. Commitments made under take-or-pay obligations represent future purchases in line with expected usage to obtain favorable pricing. Approximately 20% relates to service contracts for information technology, human resources management and facilities management activities that have... -
Page 42
... Financial Statements. Employee Benefits We sponsor various post-employment benefits throughout the world. These include pension plans, both defined contribution plans and defined benefit plans, and other postemployment benefit (OPEB) plans, consisting primarily of health care and life insurance... -
Page 43
... lives. Our assessment as to brands that have an indefinite life and those that have a determinable life is based on a number of factors including competitive environment, market share, brand history, underlying product life cycles, operating plans and the macroeconomic environment of the countries... -
Page 44
... the estimated fair value of the Salon Professional business now slightly exceeds its carrying value. Our fiscal 2013 valuations of the Appliances and Salon Professional businesses has them returning to sales and earnings growth rates consistent with our long-term business plans. Failure to achieve... -
Page 45
... our financial statements. Currency Rate Exposure on Financial Instruments. Because we manufacture and sell products and finance operations in a number of countries throughout the world, we are exposed to the impact on revenue and expenses of movements in currency exchange rates. Corporate policy... -
Page 46
44 The Procter & Gamble Company The table below provides a reconciliation of reported diluted net earnings per share from continuing operations to Core EPS: Years ended June 30 2013 2012 2011 Item 7A. Quantitative and Qualitative Disclosures About Market Risk. The information required by this ... -
Page 47
... to permit the preparation of financial statements conforming in all material respects with accounting principles generally accepted in the United States of America. We monitor these internal controls through control self-assessments conducted by business unit management. In addition to performing... -
Page 48
... Balance Sheets of The Procter & Gamble Company and subsidiaries (the "Company") as of June 30, 2013 and 2012, and the related Consolidated Statements of Earnings, Comprehensive Income, Shareholders' Equity and Cash Flows for each of the three years in the period ended June 30, 2013. These financial... -
Page 49
... financial reporting is a process designed by, or under the supervision of, the company's principal executive and principal financial officers, or persons performing similar functions, and effected by the company's board of directors, management, and other personnel to provide reasonable assurance... -
Page 50
48 The Procter & Gamble Company Consolidated Statements of Earnings Amounts in millions except per share amounts; Years ended June 30 2013 2012 2011 NET SALES Cost of products sold Selling, general and administrative expense Goodwill and indefinite-lived intangible asset impairment charges ... -
Page 51
The Procter & Gamble Company 49 Consolidated Statements of Comprehensive Income Amounts in millions; Years ended June 30 2013 2012 2011 NET EARNINGS OTHER COMPREHENSIVE INCOME/(LOSS), NET OF TAX Financial statement translation Unrealized gains/(losses) on cash flow hedges (net of $92, $441 and $... -
Page 52
... Reserve for ESOP debt retirement Accumulated other comprehensive income/(loss) Treasury stock, at cost (shares held: 2013 - 1,266.9, 2012 - 1,260.4) Retained earnings Noncontrolling interest TOTAL SHAREHOLDERS' EQUITY TOTAL LIABILITIES AND SHAREHOLDERS' EQUITY 2013 2012 $ 5,947 6,508 1,704 722... -
Page 53
... interest, net BALANCE JUNE 30, 2012 Net earnings Other comprehensive income Dividends to shareholders: Common Preferred, net of tax benefits Treasury purchases Employee plan issuances Preferred stock conversions ESOP debt impacts Noncontrolling interest, net BALANCE JUNE 30, 2013 2,843,471... -
Page 54
... 30 2013 2012 2011 CASH AND CASH EQUIVALENTS, BEGINNING OF YEAR OPERATING ACTIVITIES Net earnings Depreciation and amortization Share-based compensation expense Deferred income taxes Gain on sale and purchase of businesses Goodwill and indefinite-lived intangible asset impairment charges Change in... -
Page 55
... Consolidated Financial Statements NOTE 1 SUMMARY OF SIGNIFICANT ACCOUNTING POLICIES Nature of Operations The Procter & Gamble Company's (the "Company," "Procter & Gamble," "we" or "us") business is focused on providing branded consumer packaged goods of superior quality and value. Our products are... -
Page 56
... been determined to have indefinite lives. We evaluate a number of factors to determine whether an indefinite life is appropriate, including the competitive environment, market share, brand history, product life cycles, operating plans and the macroeconomic environment of the countries in which the... -
Page 57
... AND INTANGIBLE ASSETS The change in the net carrying amount of goodwill by reportable segment was as follows: Health Care Fabric Care Baby Care Total and Home and Family Care Corporate Company Care Beauty Grooming $ 18,039 $ Accumulated impairment losses at June 30, 2011 - GOODWILL at JUNE 30... -
Page 58
... Procter & Gamble Company In October 2012, the Company acquired our partner's interest in a joint venture in Iberia that operates in our Baby Care and Family Care and Health Care reportable segments. We paid $1.1 billion for our partner's interest and the transaction was accounted for as a business... -
Page 59
..., research and development, marketing and overheads. The productivity and cost savings plan was designed to accelerate cost reductions by streamlining management decision making, manufacturing and other work processes in order to help fund the Company's growth strategy. The Company expects to incur... -
Page 60
... cost to change internal systems and processes to support the underlying organizational changes. Consistent with our historical policies for ongoing restructuring-type activities, the restructuring program charges are funded by and included within Corporate for both management and segment reporting... -
Page 61
...RISK MANAGEMENT ACTIVITIES AND FAIR VALUE MEASUREMENTS As a multinational company with diverse product offerings, we are exposed to market risks, such as changes in interest rates, currency exchange rates and commodity prices. We evaluate exposures on a centralized basis to take advantage of natural... -
Page 62
...most insurable risks. However, we purchase insurance for Directors and Officers Liability and certain other coverage where it is required by law, by contract or deemed to be in the best interest of the Company. Fair Value Hierarchy Accounting guidance on fair value measurements for certain financial... -
Page 63
... the fair value hierarchy: Level 1 June 30 2013 2012 2013 Level 2 2012 2013 Level 3 2012 2013 Total 2012 ASSETS RECORDED AT FAIR VALUE Investments: U.S. government securities Other investments Derivatives relating to: Foreign currency hedges Other foreign currency instruments(1) Interest rates Net... -
Page 64
... Procter & Gamble Company During fiscal 2013 and 2012, we recorded impairments of certain goodwill and intangible assets. Also, during fiscal 2013, we applied purchase accounting and re-measured assets and liabilities at fair value related to the purchase of the balance of a joint venture in Iberia... -
Page 65
...Gamble less preferred dividends (net of related tax benefits) are divided by the weighted average number of common shares outstanding during the year to calculate basic net earnings per common share. Diluted net earnings per common share are calculated to give effect to stock options and other stock... -
Page 66
...compensation plans under which we annually grant stock option, restricted stock, restricted stock unit (RSU) and performance stock unit (PSU) awards to key managers and directors. Exercise prices on options granted have been, and continue to be, set equal to the market price of the underlying shares... -
Page 67
...15% of total participants' annual wages and salaries in 2013, 2012 and 2011. We maintain The Procter & Gamble Profit Sharing Trust (Trust) and Employee Stock Ownership Plan (ESOP) to provide a portion of the funding for the U.S. DC plan and other retiree benefits (described below). Operating details... -
Page 68
66 The Procter & Gamble Company reduces our cash contribution required to fund the U.S. DC plan. Defined Benefit Retirement Plans and Other Retiree Benefits We offer defined benefit retirement pension plans to certain employees. These benefits relate primarily to local plans outside the U.S. and, ... -
Page 69
...Obligation Exceeds the Fair Value of Plan Assets 2013 2012 Projected benefit obligation Accumulated benefit obligation Fair value of plan assets $ 12,024 10,406 6,086 $ 11,623 10,009 6,013 $ 12,962 11,149 6,895 $ 12,310 10,533 6,583 Amounts in millions of dollars except per share amounts or as... -
Page 70
... Benefits 2013 2012 ASSUMPTIONS USED TO DETERMINE BENEFIT OBLIGATIONS(1) Discount rate Rate of compensation increase ASSUMPTIONS USED TO DETERMINE NET PERIODIC BENEFIT COST(2) Discount rate Expected return on plan assets Rate of compensation increase ASSUMED HEALTH CARE COST TREND RATES Health care... -
Page 71
... expected rate of return on Company stock is based on the long-term projected return of 8.5% and reflects the historical pattern of returns. Assumed health care cost trend rates could have a significant effect on the amounts reported for the other retiree benefit plans. A one percentage point change... -
Page 72
...The Procter & Gamble Company Other Retiree Benefits Level 1 June 30 2013 2012 2013 Level 2 2012 2013 Level 3 2012 2013 Total 2012 ASSETS AT FAIR VALUE Cash and cash equivalents Company stock Common collective fund - equity Common collective fund - fixed income Other TOTAL ASSETS AT FAIR VALUE $ 56... -
Page 73
... for the year ended June 30, 2013. This primarily relates to the impact of certain adjustments to pension obligations recorded in shareholders' equity, partially offset by excess tax benefits from the exercise of stock options. Tax benefits credited to shareholders' equity totaled $661 for the year... -
Page 74
... TAX ASSETS Pension and postretirement benefits Stock-based compensation Loss and other carryforwards Goodwill and other intangible assets Accrued marketing and promotion Fixed assets Unrealized loss on financial and foreign exchange transactions Accrued interest and taxes Inventory Other Valuation... -
Page 75
... Paper). Purchase obligations $1,114 $ 383 $ 242 $ 136 $ 74 $ 234 Such amounts represent future purchases in line with expected usage to obtain favorable pricing. Approximately 20% of our purchase commitments relate to service contracts for information technology, human resources management and... -
Page 76
...assets managed by the reportable segment, primarily inventory, fixed assets and intangible assets. Other assets, primarily including cash, accounts receivable, investment securities and goodwill, are included in Corporate. Our business units are comprised of similar product categories. In 2013, 2012... -
Page 77
... from discontinued operations in the Consolidated Statement of Earnings for the year ended June 30, 2012. The snacks business had historically been part of the Company's Snacks and Pet Care reportable segment. In accordance with the applicable accounting guidance for the disposal of long-lived... -
Page 78
... the Company's Chief Financial Officer, Jon R. Moeller, performed an evaluation of the Company's disclosure controls and procedures (as defined in Rules 13a-15(e) and 15d-15(e) of the Securities Exchange Act of 1934 (Exchange Act)) as of the end of the period covered by this Annual Report on Form 10... -
Page 79
...Procter & Gamble 1993 Non-Employee Directors' Stock Plan; The Procter & Gamble Future Shares Plan; The Procter & Gamble 2001 Stock and Incentive Compensation Plan; The Procter & Gamble 2003 NonEmployee Directors' Stock Plan; The Gillette Company 1971 Stock Option Plan; The Gillette Company 2004 Long... -
Page 80
... result of the merger. After the merger, all outstanding options became options to purchase shares of The Procter & Gamble Company subject to an exchange ratio of .975 shares of P&G stock per share of Gillette stock. Only employees previously employed by The Gillette Company prior to October 1, 2005... -
Page 81
... (10-1) of the Company's Form 10-Q for the quarter ended December 31, 2008).* The Procter & Gamble 1992 Stock Plan (as amended December 11, 2001), which was originally adopted by the shareholders at the annual meeting on October 12, 1992.* + The Procter & Gamble Executive Group Life Insurance Policy... -
Page 82
... of the Company's Form 10-Q for the quarter ended September 30, 2012).* The Gillette Company Executive Life Insurance Program (Incorporated by reference to Exhibit (10-15) of the Company's Annual Report on Form 10-K for the year ended June 30, 2012).* The Gillette Company Personal Financial Planning... -
Page 83
... quarter ended March 31, 2012) and related terms and conditions (Incorporated by reference to Exhibit (10-24) of the Company's Annual Report on Form 10-K for the year ended June 30, 2012). * Computation of Earnings Per Share. + Computation of Ratio of Earnings to Fixed Charges. + Subsidiaries of the... -
Page 84
... in the city of Cincinnati, State of Ohio. THE PROCTER & GAMBLE COMPANY By /s/ A.G. LAFLEY (A.G. Lafley) Chairman of the Board, President and Chief Executive Officer August 8, 2013 Pursuant to the requirements of the Securities Exchange Act of 1934, this report has been signed below by the... -
Page 85
...Gamble Executive Group Life Insurance Policy.* The Procter & Gamble Deferred Compensation Plan for Directors (as amended December 12, 2006), which was originally adopted by the Board of Directors on September 9, 1980 (Incorporated by reference to Exhibit (10-4) of the Company's Annual Report on Form... -
Page 86
... Procter & Gamble Company (10-15) - The Gillette Company Personal Financial Planning Reimbursement Program (Incorporated by reference to Exhibit (10-16) of the Company's Annual Report on Form 10-K for the year ended June 30, 2012) .* The Gillette Company Senior Executive Financial Planning Program... -
Page 87
... liquidity trends. The Company's long-term target is to generate free cash flow at or above 90 percent of net earnings. We view adjusted free cash flow productivity as an important measure because it is a factor in determining the amount of cash available for dividends and discretionary investment... -
Page 88
... Business Development Officer Deborah P. Majoras Chief Legal Officer and Secretary Jon Moeller Chief Financial Officer Dimitri Panayotopoulos Vice Chairman and Advisor to the Chairman and Chief Executive Officer Filippo Passerini Group President - Global Business Services and Chief Information... -
Page 89
... as a leading global company, earning a variety of awards and recognition in several key areas. REPUTATION AND LEADERSHIP DIVERSITY Forbes ranked P&G #41 on the list of the World's Most Reputable Companies, and we earned a #13 ranking on the America's Most Reputable Companies list. Fortune named... -
Page 90
... & Gamble Company P.O. Box 599, Cincinnati, OH 45201-0599 P&G SHAREHOLDER INVESTMENT PROGRAM The Procter & Gamble Shareholder Investment Program (SIP) is a direct stock purchase and dividend reinvestment plan. The SIP is open to current P&G shareholders as well as new investors and is designed to... -
Page 91
... look for ways to be more productive and use our resources and materials efficiently, we're creating value for P&G consumers and shareholders, and delivering cost savings that fuel our growth. 50 % ~ 5,000 metric tons Using trucks powered by natural gas delivers cost savings and helps us reduce... -
Page 92
©2013 Procter & Gamble 00387128