Plantronics 2015 Annual Report Download - page 3
Download and view the complete annual report
Please find page 3 of the 2015 Plantronics annual report below. You can navigate through the pages in the report by either clicking on the pages listed below, or by using the keyword search tool below to find specific information within the annual report.-
 1
1 -
 2
2 -
 3
3 -
 4
4 -
 5
5 -
 6
6 -
 7
7 -
 8
8 -
 9
9 -
 10
10 -
 11
11 -
 12
12 -
 13
13 -
 14
14 -
15
-
16
-
17
-
18
-
19
-
20
-
21
-
22
-
23
-
24
-
25
-
26
-
27
-
28
-
29
-
30
-
31
-
32
-
33
-
34
-
35
-
36
-
37
-
38
-
39
-
40
-
41
-
42
-
43
-
44
-
45
-
46
-
47
-
48
-
49
-
50
-
51
-
52
-
53
-
54
-
55
-
56
-
57
-
58
-
59
-
60
-
61
-
62
-
63
-
64
-
65
-
66
-
67
-
68
-
69
-
70
-
71
-
72
-
73
-
74
-
75
-
76
-
77
-
78
-
79
-
80
-
81
-
82
-
83
-
84
-
85
-
86
-
87
-
88
-
89
-
90
-
91
-
92
-
93
-
94
-
95
-
96
 |
 |

Plantronics Annual Report 2015
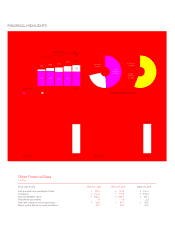
FINANCIAL HIGHLIGHTS
Revenue by Product Group
Annual Revenue by Product Group ($MM)1
Other Financial Data
In millions
Fiscal years ended
Cash provided from operating activities
Total assets
Total stockholders’ equity
Total shares repurchased
Total cash utilized for stock repurchases
Shares used in diluted per share calculation
March 31, 2013 March 31, 2014 March 31, 2015
FY2015 Revenue Breakdown
and YoY Growth
Revenue by Product Group
Revenue by Geography
Diluted GAAP Earnings Per Common
Share–Continuing Operations
Dollars
Cash/Cash Equivalents,
Short- and Long-Term Investments
Dollars in millions
Fiscal Year
Core Enterprise Unified Communications $865 Million Total RevenueConsumer
1Fiscal year ends March 31, 2015
Fiscal Year Fiscal Year
$ 125.5
$ 764.6
$ 646.4
.8
$ 23.9
42.7
$ 141.5
$ 811.8
$ 698.7
1.9
$ 85.7
43.4
$ 154.4
$ 876.0
$ 727.4
2.2
$ 112.9
42.6
2011 2012 2013 2014
2011 2012 2013 2014 2011 2012 2013 2014
2015
2015 2015
2.63 482.3
2.21
2.41 2.49 2.59 469.3
389.9
425.6 435.8
684
438
53
193
713
438
93
182
762
CAGR: 6.1%
418
131
213
819
423
166
230
865
423
196
246
Consumer
$246MM
7%
Growth
18%
Growth
9%
Growth
11%
Growth
3%
Growth
0%
Growth
10%
Growth
Unified
Communications
$196MM
Core
Enterprise
$423MM
United
States
$487MM
Europe
and Africa
$214MM
Asia Pacific
$105MM
Americas
$59MM