Panasonic 2014 Annual Report Download - page 11
Download and view the complete annual report
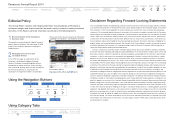
Please find page 11 of the 2014 Panasonic annual report below. You can navigate through the pages in the report by either clicking on the pages listed below, or by using the keyword search tool below to find specific information within the annual report.-
 1
1 -
 2
2 -
 3
3 -
 4
4 -
 5
5 -
 6
6 -
 7
7 -
 8
8 -
 9
9 -
 10
10 -
 11
11 -
 12
12 -
 13
13 -
 14
14 -
 15
15 -
 16
16 -
 17
17 -
 18
18 -
 19
19 -
 20
20 -
 21
21 -
 22
22 -
23
-
24
-
25
-
26
-
27
-
28
-
29
-
30
-
31
-
32
-
33
-
34
-
35
-
36
-
37
-
38
-
39
-
40
-
41
-
42
-
43
-
44
-
45
-
46
-
47
-
48
-
49
-
50
-
51
-
52
-
53
-
54
-
55
 |
 |

FY2014 FY2015 FY2016
Improve profitability towards 5% operating profit ratio
in each business division
Eliminate unprofitable businesses
Restructuring
Complete
in
2
years
FCF
≥
600.0 billion yen (cumulative total in FY14-16)
Mid-Term Management Plan Roadmap
Business transfers associated with reorganization of the Appliances Company
Operating
profit
Net income*
Operating profit
≥
350.0 bil. yen
Operating profit
ratio
≥
5%
Resumption of
dividend payment
Cold chain/air-conditioner
equipment sales companies (Japan)
Eco Solutions
AVC Networks Appliances
Other/Corporate
Consumer electronics businesses
(TVs, BD Recorders, etc.)
SANYO TV business
Air-conditioner sales divisions (Europe & US)
Changes in Segments 50.0 bil. yen
250.0 bil. yen
Since its establishment, the Panasonic
Group has managed its business under
the concept that returning prots to
shareholders is one of the most important
policies. Under this basic concept, the
Panasonic Group continues to distribute
prots to shareholders from the
perspective of the return on the capital
investment made by them. The basis for
Resumption of Dividend Payments
On April 1, 2014, Panasonic changed its
segment breakdown. Business transfers
associated with the reorganization of the
Appliances Company and other factors
have been reected as appropriate.
Please refer to pages 35–36 “Overview
of Business Divisions” for details.
Changes in Segments
The rst year of the “Cross-Value Innovation
2015” (CV2015) mid-term management
plan, scal 2014 had as its nancial targets
operating prot of more than 250.0 billion
yen, net income attributable to Panasonic
Corporation of more than 50.0 billion yen,
and the resumption of dividend payments.
We achieved all these targets.
Of the four major measures, we had the
denite prospect arise in the rst scal year
of achieving the following: (1) eliminating
unprotable businesses, (2) improving
the Company’s nancial position, and
(3) expanding business and improving
efciency by shifting from an in-house
approach.
Fiscal 2014 Achievements and
Current Issues
We outlined major decisions and
directions on ve major challenging
businesses, including TV set/panels,
assessing their future, shifting into new
business areas, reducing assets, and
reorganizing facilities. We also worked on
the air conditioner and DSC businesses,
Progress of Four Major Measures
1. Eliminate Unprofitable Businesses
Progress with
Mid-Term
Management Plan
Cross-Value Innovation 2015
the distribution of prots is, in principle,
the consolidated business performance
of the Panasonic Group, which aims for
stable and continuous growth in dividends
as well as a dividend payout ratio of
between 30% and 40% with respect to
consolidated net income attributable to
Panasonic Corporation.
Due to the steady improvement in its
business results and nancial position in
scal 2014, the Company resumed dividend
payments with an annual cash dividend
of 13 yen per share, comprising an interim
dividend of 5 yen and a year-end dividend
of 8 yen.
Pre-tax income improved signicantly to
206.2 billion yen from a loss of 398.4
billion yen, and net income attributable to
Panasonic Corporation improved to 120.4
billion yen from a loss of 754.3 billion yen,
respectively. Return on equity (ROE) was
thus a positive 8.6%, compared with a
negative 47.2% in the previous scal year.
Free cash ow amounted to 594.1 billion
yen, an increase of 238.9 billion yen from
a year ago and greatly exceeding the “more
than 200.0 billion yen” target announced
at the start of scal 2014, due primarily to
Group-wide efforts to generate cash.
* Net income attributable to Panasonic Corporation
▶▶
To Our Stakeholders ▶
President’s Message Performance in FY2014 / Progress with Mid-Term Management Plan / FY2015 Initiatives
About Panasonic Top Message Message
from the CFO Business Overview Corporate
Governance
Management
Topics
Panasonic Annual Report 2014 Search Contents Return NextPAGE
10
Highlights
Financial and
Corporate Information