Panasonic 2013 Annual Report Download - page 4
Download and view the complete annual report
Please find page 4 of the 2013 Panasonic annual report below. You can navigate through the pages in the report by either clicking on the pages listed below, or by using the keyword search tool below to find specific information within the annual report.-
 1
1 -
 2
2 -
 3
3 -
 4
4 -
 5
5 -
 6
6 -
 7
7 -
 8
8 -
 9
9 -
 10
10 -
 11
11 -
 12
12 -
 13
13 -
 14
14 -
 15
15 -
16
-
17
-
18
-
19
-
20
-
21
-
22
-
23
-
24
-
25
-
26
-
27
-
28
-
29
-
30
-
31
-
32
-
33
-
34
-
35
-
36
 |
 |

0
2
4
6
8
10
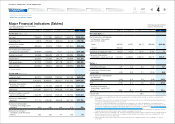
20132012201120102009
3.5
3.8
7.3
0
100
200
300
400
0
1.0
2.0
3.0
4.0
20132012201120102009
160.9
2.2%
–900
–600
–300
0
300
–12.0
–8.0
–4.0
0
4.0
20132012201120102009
–
10.3%
–
754.3
0
200
400
600
800
0
2.0
4.0
6.0
8.0
20132012201120102009
6.9%
502.2
0
100
200
300
400
500
20132012201120102009
277.6
310.9
0
1
2
3
–60.0
–30.0
0
30.0
20132012201120102009
1.3
–
47.2%
–400
–200
0
200
400
20132012201120102009
355.2
0
10
20
30
40
0
10.0
20.0
30.0
40.0
2013*2012*20112010*2009*
0 yen
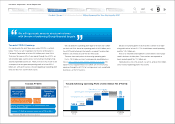
Major Financial Indicators (Graphs)
Panasonic Corporation and Subsidiaries
Years ended March 31
Net Sales
Capital Investment and Depreciation
(Tangibles)*
(Trillions of yen)
(Billions of yen)
Domestic
Overseas
Capital Investment
Depreciation
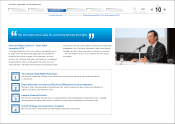
Operating Profit and Ratio to Sales
Panasonic Corporation Shareholders’
Equity and ROE
(Billions of yen) (%)
(Trillions of yen) (%)
Net Income (Loss) Attributable to Panasonic
Corporation and Ratio to Sales
Free Cash Flow
(Billions of yen) (%)
(Billions of yen)
R&D Expenditures and Ratio to Sales
Dividends Declared per Share
and Payout Ratio
(Billions of yen) (%)
(Yen) (%)
Operating Profit [left scale]
Operating Profit/Sales Ratio [right scale]
Panasonic Corporation Shareholders’ Equity [left scale]
ROE [right scale]
Net Income (Loss) Attributable to Panasonic Corporation [left scale]
Net Income (Loss) Attributable to Panasonic Corporation/Sales
Ratio [right scale]
Free Cash Flow
R&D Expenditures [left scale]
R&D Expenditures/Sales Ratio [right scale]
Dividends Declared per Share [left scale]
Payout Ratio [right scale]
PAGE
3
Panasonic Corporation Annual Report 2013
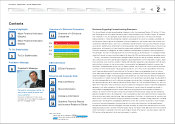
Financial Highlights
>>
Major Financial Indicators (Graphs)
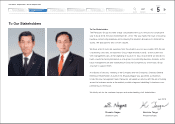
To Our Stakeholders
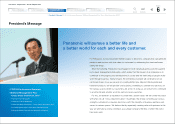
President’s Message
Overview of 4 Divisional Companies
ESG Information
Financial and Corporate Data
Search
Contents
>>
Major Financial Indicators (Tables)
* Please refer to Note 5 on page 4.
* Please refer to Note 6 on page 4.