Olympus 2006 Annual Report Download - page 9
Download and view the complete annual report
Please find page 9 of the 2006 Olympus annual report below. You can navigate through the pages in the report by either clicking on the pages listed below, or by using the keyword search tool below to find specific information within the annual report.-
 1
1 -
 2
2 -
 3
3 -
 4
4 -
 5
5 -
 6
6 -
 7
7 -
 8
8 -
 9
9 -
 10
10 -
 11
11 -
 12
12 -
 13
13 -
 14
14 -
 15
15 -
 16
16 -
 17
17 -
 18
18 -
 19
19 -
 20
20 -
21
-
22
-
23
-
24
-
25
-
26
-
27
-
28
-
29
-
30
-
31
-
32
-
33
-
34
-
35
-
36
-
37
-
38
-
39
-
40
-
41
-
42
-
43
-
44
-
45
-
46
-
47
-
48
-
49
-
50
-
51
-
52
-
53
-
54
-
55
-
56
-
57
-
58
-
59
 |
 |

Profit Recovery in the Imaging Systems Business
> The most notable accomplishment in fiscal 2006 was the
Imaging Systems Business’ return to profitability. This is
attributed to Olympus’ initiative for business operations with
emphasis on profit-making in accordance with business strate-
gies announced last autumn, aiming at the establishment of
a sustainable profit base. There are two points to consider:
selection and concentration, and cost reduction.
In order to implement selection and concentration, Olympus
will concentrate its resources on business areas where it can
utilize its core competence in “Opto-Digital Technology.” In
practice, it will concentrate its resources on the reestablish-
ment of the foundations of its digital compact camera business,
strengthening of the digital single-lens reflex (SLR) camera busi-
ness, where market expansion is expected, and the optical
component business, in which Olympus can make use of its
strengths.
On the cost-reduction front, we cut overall costs, including
production costs and inventories.
As a result of implementing profit-oriented measures, we
improved our profit despite the decrease in sales volume.
Furthermore, we successfully reduced inventories. Against this
backdrop, the Imaging Systems Business restored profitability
more efficiently than expected.
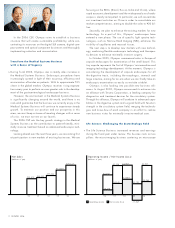
Full-Scale Recover y and Fur ther Growth
> The Imaging Systems Business is unmistakably changing, but
reforms are only half done. Olympus is going to be put to the
test in this coming year as to whether or not it will be able to
create sustainable profits and build the foundations for solid
growth.
In fiscal 2006, ended March 31, 2006, Olympus record-
ed an increase in net sales for the 12th consecutive year.
In addition, operating income reached a record-high level
of ¥62.5 billion.
An overview of fiscal 2006 and the medium- and long-
term management plan are presented below.
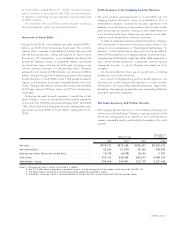
Overview of Fiscal 2006
> During fiscal 2006, consolidated net sales totaled ¥978.1
billion, up 20.2% from the previous fiscal year. This is attrib-
uted to sales increases in the Medical Systems Business and
the Life Science Business. Along with growth of sales in those
Businesses, ITX Corporation, a consolidated subsidiary that
joined the Olympus Group in September 2004, contributed
to overall earnings in the course of the year, bringing a sig-
nificant revenue increase. On the earnings front, Olympus
achieved a net income of ¥28.6 billion, an increase of ¥40.4
billion, owing to the growth of operating income in the Imaging
Systems Business in fiscal 2006, while it had posted an operat-
ing loss in the previous fiscal year. Propelled by the rise in rev-
enues, Olympus decided to increase the annual cash dividend
of ¥15 per share to ¥22 per share, up ¥7 from the previous
fiscal year.
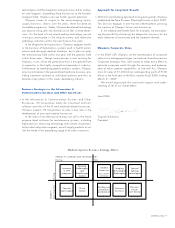
Following the path to profit recovery, I would like to talk
about Olympus’ vision for enhanced value creation capability
in line with the “FY2006 Corporate Strategic Plan” (the 2006
CSP), which draws up a three-year business development strat-
egy covering fiscal 2007 to fiscal 2009, ending March 31,
2009.
Thousands of
Millions of yen U.S. dollars
2006 2005 2004 2006
Net sales ............................................................................ ¥978,127 ¥813,538 ¥633,622 $8,505,452
Net income (loss) ................................................................. 28,564 (11,827) 33,564 248,382
Earnings per share—Basic net income (loss) .............................. 105.99 (44.98) 126.96 0.922
Total assets ......................................................................... 976,132 858,083 682,673 8,488,104
Shareholders’ equity ............................................................. 290,656 240,837 252,179 2,527,443
Notes: 1. Earnings per share is shown in yen and U.S. dollars.
2. The U.S. dollar amounts have been translated from yen, for the convenience of the reader, at the rate of ¥115=US$1.00
3. The above figures are based on accounting principles generally accepted in Japan.
4. Diluted net income per share is not presented due to the fact that there were no potentially dilutive common shares.
OLYM PUS 20 06 7