O'Reilly Auto Parts 2004 Annual Report Download - page 17
Download and view the complete annual report
Please find page 17 of the 2004 O'Reilly Auto Parts annual report below. You can navigate through the pages in the report by either clicking on the pages listed below, or by using the keyword search tool below to find specific information within the annual report.-
 1
1 -
2
-
3
-
4
-
5
-
6
-
 7
7 -
 8
8 -
 9
9 -
 10
10 -
 11
11 -
 12
12 -
 13
13 -
 14
14 -
 15
15 -
 16
16 -
 17
17 -
 18
18 -
 19
19 -
 20
20 -
 21
21 -
 22
22 -
 23
23 -
 24
24 -
 25
25 -
 26
26 -
 27
27 -
28
-
29
-
30
-
31
-
32
-
33
-
34
-
35
-
36
-
37
-
38
-
39
-
40
-
41
-
42
-
43
-
44
-
45
-
46
-
47
-
48
-
49
-
50
-
51
-
52
-
53
-
54
-
55
-
56
 |
 |

2004 ANNUAL REPORT 15
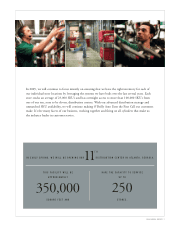
We focus on finding only the best team members who will embrace our values and commit to work
together to help our customers. All new team members are given extensive training on the O’Reilly
Culture and the importance of those eleven values to the success of our company. Our culture is rein-
forced to veteran team members through internal posters, publications, meetings and promotions. We
dedicate a great deal of time and resources to reinforce the values of the O’Reilly Culture and our sense
of unity as One Team committed to One Goal. We believe that there is nothing more important than
investing in our team members, as they are our biggest asset. Our team members have brought us suc-
cess and will continue to drive us forward in the years ahead.
In 2005, we plan to open 160 new stores,
located primarily in the southeast to
further capitalize on our distribution
centers in Alabama and Georgia.
Numbers of Stores
20042003200220012000
981
1,249
875
1,109
672
Product sales increased 13.9% in 2004 and
we are geared up to reach our 2-4-Your
Future goal of $2 billion in sales by
December 31, 2005.
Product Sales
(in millions)
20042003200220012000
$890.4
$1,092.1
$1,312.5
$1,511.8
$1,721.2
Comparable store product sales measures
increases in sales of existing stores open
at least one year.
Comparable Store Sales
20042003200220012000
3.7%
6.8%
8.8%
7.8%
5.0%