Northrop Grumman 2012 Annual Report Download - page 2
Download and view the complete annual report
Please find page 2 of the 2012 Northrop Grumman annual report below. You can navigate through the pages in the report by either clicking on the pages listed below, or by using the keyword search tool below to find specific information within the annual report.-
 1
1 -
 2
2 -
 3
3 -
 4
4 -
 5
5 -
 6
6 -
 7
7 -
 8
8 -
 9
9 -
 10
10 -
 11
11 -
 12
12 -
 13
13 -
14
-
15
-
16
-
17
-
18
-
19
-
20
-
21
-
22
-
23
-
24
-
25
-
26
-
27
-
28
-
29
-
30
-
31
-
32
-
33
-
34
-
35
-
36
-
37
-
38
-
39
-
40
-
41
-
42
-
43
-
44
-
45
-
46
-
47
-
48
-
49
-
50
-
51
-
52
-
53
-
54
-
55
-
56
-
57
-
58
-
59
-
60
-
61
-
62
-
63
-
64
-
65
-
66
-
67
-
68
-
69
-
70
-
71
-
72
-
73
-
74
-
75
-
76
-
77
-
78
-
79
-
80
-
81
-
82
-
83
-
84
-
85
-
86
-
87
-
88
-
89
-
90
-
91
-
92
-
93
-
94
-
95
-
96
-
97
-
98
-
99
-
100
-
101
-
102
-
103
-
104
 |
 |

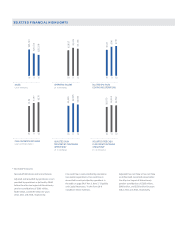
SELECTED FINANCIAL HIGHLIGHTS
* Non-GAAP measures
Non-GAAP definitions and reconciliations:
Adjusted cash provided by operations is cash
provided by operations as defined by GAAP
before the after-tax impact of discretionary
pension contributions of $193 million,
$648 million, and $539 million for years
2012, 2011 and 2010, respectively.
Free cash flow is cash provided by operations
less capital expenditures. Free cash flow is
reconciled to cash provided by operations in
the table on page 34 of Part II, Item 7, “Liquidity
and Capital Resources,” in the Form 10-K
included in these materials.
Adjusted free cash flow is free cash flow
as defined and reconciled above before
the after-tax impact of discretionary
pension contributions of $193 million,
$648 million, and $539 million for years
2012, 2011 and 2010, respectively.
$25,218
$1.97
$2.15
11 12
11 12
10
10
$28,143
$26,412
$1.84
SALES
CASH DIVIDENDS DECLARED
($ in millions )
$7.41
$7.81
$2,503
$2,502
11 12
11 12
10
10
$6.32
$2,010
ADJUSTED FREE CASH
FLOW FROM CONTINUING
OPERATIONS*
DILUTED EPS FROM
CONTINUING OPERATIONS
($ in millions ) ( $ in millions )
$3,276
$3,130
$2,995
$2,833
11 12
11 12
10
10
$2,827
$2,595
ADJUSTED CASH
PROVIDED BY CONTINUING
OPERATIONS*
OPERATING INCOME
(per common share )
($ in millions )