North Face 2009 Annual Report Download - page 15
Download and view the complete annual report
Please find page 15 of the 2009 North Face annual report below. You can navigate through the pages in the report by either clicking on the pages listed below, or by using the keyword search tool below to find specific information within the annual report.-
 1
1 -
2
-
3
-
4
-
 5
5 -
 6
6 -
 7
7 -
 8
8 -
 9
9 -
 10
10 -
 11
11 -
 12
12 -
 13
13 -
 14
14 -
 15
15 -
 16
16 -
 17
17 -
 18
18 -
 19
19 -
 20
20 -
 21
21 -
 22
22 -
 23
23 -
 24
24 -
 25
25
 |
 |

28 29
090807 090807 090807 090807 090807*
RE VE NUE
PR OF IT
2,387
2,742
2,752
2,897
2,765
2,522
370
988
142
132
87
631
571
42
498
52
195
24
451
52
472
37
67
991
865
379
479
393
454
508
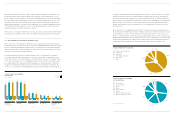
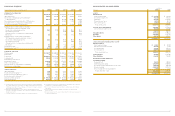
TOTA L R E V E N U E S B Y C H A N N E L
OF DISTRIBUTION
27% International
18% Specialty Stores
17% Retail*
15% Mass
10% Royalties/Other
7% Chains
3% Upscale Department Stores
3% Mainline Department Stores
* Includes international retail
* Brands acquired in mid-2007
TOTA L R E V E N U E S B Y C O A L I T I O N
38% Outdoor & Action Sports
35% Jeanswear
12% Imagewear
7% Contemporary Brands
7% Sportswear
1% Other
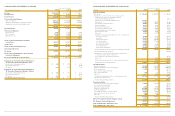
3-YEAR COALITION REVENUES
AND PROFITS
(Dollars in Millions)
Revenues in 2009 were down 6%, with foreign currency translation accounting for two
percentage points of the decline. Despite lower revenues, gross margins rose to record
levels, underscoring the strength of our brands. Earnings per share were $5.16 excluding a
$1.03 per share noncash impairment charge for goodwill and intangible assets. Our earn-
ings in both 2009 and 2008 included unusual items. In 2009, earnings were impacted by
higher pension expenses, foreign currency translation effects, and the impairment charge.
2008 earnings included expenses to reduce costs. Excluding these items in both years,
earnings per share would have risen by 2% in 2009.
We’re proud of our long dividend history, but I’m particularly proud that despite the challeng-
ing environment, 2009 marked the 37th year of higher dividend payments to shareholders.
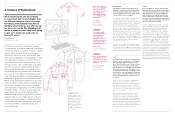
2009: THE STRENGTH TO CHANGE IN CHANGING TIMES
We took decisive action in 2009 to ensure that our company remained strong and well
positioned for future growth. We reduced costs by more than $100 million and cut inventories
by 17%, all while maintaining the highest levels of customer service. We further strength-
ened our balance sheet, nearly doubling our cash position by year-end. We reported record
cash flow from operations of nearly $1 billion.
Focused investments drove solid results in many areas of our business. For example,
we continued the global momentum in our Outdoor & Action Sports businesses, with
revenue growth in our two largest brands — The North Face® was up 6%, and Vans® grew
by 5%. We gained share in our core Wrangler® and Lee® brands in the United States with
successful new product innovations and compelling in-store presentations. Conditions
in upper-tier department and specialty stores have been very difficult, but international
revenues of our premium 7 For All Mankind® brand increased in 2009. Our growth in Asia
continued, with 2009 revenues increasing by 28%. Finally, we grew our direct-to-consumer
business, with a 6% increase in revenues and the opening of 90 new stores. Acquisitions
are always an important component of our long-term growth plans. In 2009 we completed
the acquisition of the Splendid® and Ella Moss® brands, further expanding our Contemporary
Brands coalition. We continue to seek acquisitions of high growth, high-margin lifestyle
brands, particularly activity-based brands that could complement our Outdoor & Action
Sports portfolio.
We’re proud of our accomplishments in 2009, but we also had our share of challenges. Our
European jeans business had a much more difficult year than we had envisioned, particularly
in Eastern Europe, where we had experienced significant growth in recent years. Our
Image (or uniform) business was hurt disproportionately during the economic downturn by
higher than anticipated levels of unemployment in key sectors. And while we are encouraged
by improving profitability in our Sportswear coalition, where operating margins returned to
double-digit levels, the Sportswear revenue trend is still not where we want it to be.
Outdoor &
Action Sports
Jeanswear Imagewear Sportswear Contemporary
Brands
38%
35%
27%
18%
17%
15%
10%
7%
3% 3%
12%
7%
7% 1%