North Face 2005 Annual Report Download - page 2
Download and view the complete annual report
Please find page 2 of the 2005 North Face annual report below. You can navigate through the pages in the report by either clicking on the pages listed below, or by using the keyword search tool below to find specific information within the annual report.-
 1
1 -
 2
2 -
 3
3 -
 4
4 -
 5
5 -
 6
6 -
 7
7 -
 8
8 -
 9
9 -
 10
10 -
 11
11 -
 12
12 -
 13
13 -
14
-
15
-
16
-
17
-
18
-
19
-
20
-
21
-
22
-
23
-
24
-
25
-
26
-
27
-
28
-
29
-
30
-
31
-
32
-
33
 |
 |

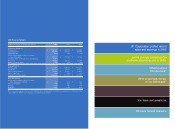
VF Corporation posted record
sales and earnings in 2005
and is strongly positioned for
another outstanding year in 2006.
What’s behind
this success?
What challenges remain
to be addressed?
You have real questions.
We have honest answers.
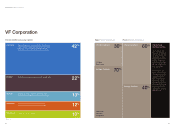
2005 Financial Highlights
Dollars in thousands, except per share amounts 2005 2004 2003
Summary of Operations
Total revenues $ 6,502,377 $ 6,124,588 $ 5,245,404
Operating income 828,177 777,788 644,889
Operating margin 12.7 12.7 12.3
Income before cumulative effect of a change
in accounting policy $518,535 $474,702 $ 397,933
Cumulative effect of a change in accounting policy* (11,833) — —
Net income* 506,702 474,702 397,933
Return on invested capital 15.2 15.8 16.6
Financial Position
Working capital $ 1,213,233 $ 1,006,354 $ 1,419,281
Current ratio 2.1 to 1 1.7 to 1 2.8 to 1
Cash flow from operations $ 561,346 $ 723,991 $ 539,672
Debt to capital ratio 22.6 28.5 33.7
Common stockholders’ equity $ 2,808,213 $ 2,513,241 $ 1,951,307
Per Common Share
Income before cumulative effect of a change
in accounting policy—diluted $ 4.54 $ 4.21 $ 3.61
Net income—diluted* 4.44 4.21 3.61
Dividends 1.10 1.05 1.01
Book value 25.50 22.56 18.04
*Net income and the related per share amount for 2005 include the cumulative effect of a change in accounting policy for stock-based compen-
sation in 2005. See details in the accompanying consolidated financial statements.
%%%
%%%
%%%