Nikon 2004 Annual Report Download - page 20
Download and view the complete annual report
Please find page 20 of the 2004 Nikon annual report below. You can navigate through the pages in the report by either clicking on the pages listed below, or by using the keyword search tool below to find specific information within the annual report.-
 1
1 -
2
-
3
-
4
-
5
-
6
-
7
-
8
-
9
-
 10
10 -
 11
11 -
 12
12 -
 13
13 -
 14
14 -
 15
15 -
 16
16 -
 17
17 -
 18
18 -
 19
19 -
 20
20 -
 21
21 -
 22
22 -
 23
23 -
 24
24 -
 25
25 -
 26
26 -
 27
27 -
 28
28 -
 29
29 -
 30
30 -
31
-
32
-
33
-
34
-
35
-
36
-
37
-
38
-
39
-
40
-
41
-
42
-
43
-
44
-
45
-
46
 |
 |

18
OPERATIONAL REVIEW AND ANALYSIS
During the year, the Nikon Group pursued policies aimed at structural reform and the fundamental enhancement of profitability. Together with
a focus on reducing variable and fixed costs, efforts were made to improve the turnover of accounts receivable and inventories. The Group also
aggressively carved out new business territories to further expand existing businesses - while continuing to increase the overseas network of
production, marketing and service bases, new products that catered to market needs were developed. Consolidated net sales totaled ¥506,378
million, up ¥37,419 million, or 8.0%, relative to the previous year. The Nikon Group recorded consolidated net income of ¥2,410 million.
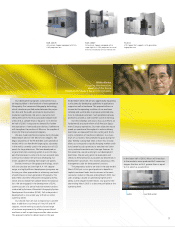
Breaking down the results by business segment, Precision Equipment posted ¥158,054 million in net sales, a year-on-year increase of
18.7%, and an operating loss of ¥20,806 million. In IC steppers, Nikon not only led the world with the introduction of immersion lithography
exposure tools, it commenced full-fledged development of next-generation extreme ultraviolet lithography (EUVL) systems. Sales of existing
products grew, including CCD sensors, on the back of a market upturn. In LCD steppers, assertive efforts aimed at increasing sales ensured
that performances considerably exceeded the previous year.
Imaging Products recorded net sales of ¥284,713 million, a 4.7% gain, while operating income amounted to ¥25,222 million. Despite
lower sales of traditional film cameras due to a contracting market, new single-lens reflex (SLR) cameras and an expanded COOLPIX line
propelled a steady increase in sales of digital cameras.
Instruments registered net sales of ¥47,992 million, dipping 3.8% relative to the previous year, alongside operating income of ¥2,685
million. Depressed sales in the United States outweighed robust sales in Japan and Asia through the launch of new products, notably the
digital microscope COOLSCOPE and the advanced research microscope Eclipse80i.
Breaking down results by geographic segment, sales increased in Japan as steady growth in LCD products offset slumping sales of steppers
despite a mild recovery in the semiconductor market. Continued expansion in the digital camera market also had positive spillover effects.
Although sales in Japan rose by 9.2% to ¥435,189 million, an operating loss of ¥3,822 million was recorded.
Overseas, despite strong growth in sales of digital cameras, sales in North America dropped 5.4% to ¥151,817 million as the sluggish
recovery in the semiconductor market forced a slowdown in sales. Operating income stood at ¥5,610 million.
In Europe, a gradual pickup in sales of steppers coupled with higher sales of digital cameras due to the booming market resulted in sales
surging 23.7%, to ¥124,763 million. The region recorded operating income of ¥863 million.
In Asia, robust economic growth led to increased sales of digital products, industrial microscopes and semiconductor inspection equipment.
The rising cost of sales, however, pushed up operating expenses. Regional sales jumped 23.5% to ¥55,890 million, while operating income
totaled ¥2,148 million.
Income Analysis
Years ended March 31, 2004 and 2003
Net sales
Cost of sales
Gross profit
SG&A expenses
Operating income
Net interest expense and dividend income
Net other income (expenses)
Income (loss) before income taxes and minority interest
Income taxes
Minority interest
Net income (loss)
Note: All expenses and subtractive amounts are in parentheses.
2003
100.0%
(65.6)
34.4
(33.5)
0.9
(0.3)
(2.9)
(2.3)
0.6
(0.0)
(1.7)
2004
100.0%
(68.5)
31.5
(30.8)
0.7
(0.3)
1.5
1.9
(1.4)
0.0
0.5
(% of Net Sales)
Balance Sheet Analysis
March 31, 2004 and 2003
Total assets
Total current assets
Inventories
Property, plant and equipment
Investments and other assets
Total current liabilities
Short-term borrowings
Long-term debt, less current portion
Shareholders’ equity
2003
100.0%
67.3
39.3
19.2
13.5
44.1
10.4
24.1
28.2
2004
100.0%
67.5
39.2
17.6
14.9
41.1
7.2
27.0
28.2
(% of Total Assets)