National Oilwell Varco 2010 Annual Report Download - page 3
Download and view the complete annual report
Please find page 3 of the 2010 National Oilwell Varco annual report below. You can navigate through the pages in the report by either clicking on the pages listed below, or by using the keyword search tool below to find specific information within the annual report.-
 1
1 -
 2
2 -
 3
3 -
 4
4 -
 5
5 -
 6
6 -
 7
7 -
 8
8 -
 9
9 -
 10
10 -
 11
11 -
 12
12 -
 13
13 -
 14
14 -
15
-
16
-
17
-
18
-
19
-
20
-
21
-
22
-
23
-
24
-
25
-
26
-
27
-
28
-
29
-
30
-
31
-
32
-
33
-
34
-
35
-
36
-
37
-
38
-
39
-
40
-
41
-
42
-
43
-
44
-
45
-
46
-
47
-
48
-
49
-
50
-
51
-
52
-
53
-
54
-
55
-
56
-
57
-
58
-
59
-
60
-
61
-
62
-
63
-
64
-
65
-
66
-
67
-
68
-
69
-
70
-
71
-
72
-
73
-
74
-
75
-
76
-
77
-
78
-
79
-
80
-
81
-
82
-
83
-
84
-
85
-
86
-
87
-
88
-
89
-
90
-
91
-
92
-
93
-
94
-
95
-
96
-
97
-
98
-
99
-
100
-
101
-
102
-
103
-
104
-
105
-
106
-
107
-
108
-
109
-
110
 |
 |

Distribution Services
Our Distribution Services segment provides maintenance, repair and operating supplies (MRO) and spare parts to drill site and production
locations worldwide. In addition to its comprehensive network of field locations supporting land drilling operations throughout North America,
the segment supports major offshore drilling contractors through locations in Mexico, the Middle East, Europe, Southeast Asia and South
America. Distribution Services employs advanced information technologies to provide complete procurement, inventory management and
logistics services to its customers around the globe. Demand for the segments services is determined primarily by the level of drilling, servicing,
and oil and gas production activities.
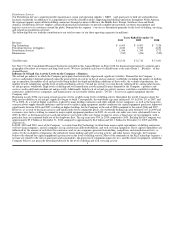
The following table sets forth the contribution to our total revenues of our three operating segments (in millions):
Years Ended December 31,
2010 2009 2008
Revenue:
Rig Technology $ 6,965 $ 8,093 $ 7,528
Petroleum Services & Supplies 4,182 3,745 4,651
Distribution Services 1,546 1,350 1,772
Eliminations (537) (476) (520)
Total Revenue $ 12,156 $ 12,712 $ 13,431
See Note 15 to the Consolidated Financial Statements included in this Annual Report on Form 10-K for financial information by segment and a
geographical breakout of revenues and long-lived assets. We have included a glossary of oilfield terms at the end of Item 1. Business of this
Annual Report.
Influence of Oil and Gas Activity Levels on the Companys Business
The oil and gas industry in which the Company participates has historically experienced significant volatility. Demand for the Companys
services and products depends primarily upon the general level of activity in the oil and gas industry worldwide, including the number of drilling
rigs in operation, the number of oil and gas wells being drilled, the depth and drilling conditions of these wells, the volume of production, the
number of well completions and the level of well remediation activity. Oil and gas activity is in turn heavily influenced by, among other factors,
oil and gas prices worldwide. High levels of drilling and well remediation activity generally spurs demand for the Companys products and
services used to drill and remediate oil and gas wells. Additionally, high levels of oil and gas activity increase cash flows available for drilling
contractors, oilfield service companies, and manufacturers of oil country tubular goods (OCTG) to invest in capital equipment that the
Company sells.
Beginning in early 2004, increasing oil and gas prices led to steadily rising levels of drilling activity throughout the world. Concerns about the
long-term availability of oil and gas supply also began to build. Consequently, the worldwide rig count increased 11% in 2006, 2% in 2007, and
7% in 2008. As a result of higher cash flows realized by many drilling contractors and other oilfield service companies, as well as the long-term
concerns about supply-demand imbalance and the need to replace aging equipment, market conditions for capital equipment purchases improved
significantly between 2006 and 2007, resulting in higher backlogs for the Company at the end of 2008 compared to the end of 2006 and 2007.
However, as a result of the financial crisis and significantly lower commodity prices, the worldwide drilling rig count declined 31% in 2009 and
customers were far less willing to commit to major capital equipment purchases in 2009. As a result, our order rates were substantially lower in
2009. In 2010, as the financial crisis eased and oil prices recovered, order rates began to improve across a broad array of rig equipment, with a
particular focus on continued build out of the deepwater fleet. The rig count rose 30% in 2010 compared to 2009. Backlog for the Company was
approximately $5.0 billion at December 31, 2010 compared to approximately $6.4 billion and $11.1 billion for December 31, 2009 and 2008,
respectively.
In 2008, 2009 and 2010, most of the Companys revenue from Rig Technology resulted from major capital expenditures of drilling contractors,
well servicing companies, and oil companies on rig construction and refurbishment, and well servicing equipment. These capital expenditures are
influenced by the amount of cash flow that contractors and service companies generate from drilling, completion, and remediation activity; as
well as by the availability of financing, the outlook for future drilling and well servicing activity, and other factors. Generally, the Company
believes the demand for capital equipment lags increases in the level of drilling activity. Most of the remainder of the Rig Technology segments
revenue are related to the sale of spare parts and consumables, the provision of equipment-repair services, and the rental of equipment, which the
Company believes are generally determined directly by the level of drilling and well servicing activity.
3