NEC 2012 Annual Report Download - page 5
Download and view the complete annual report
Please find page 5 of the 2012 NEC annual report below. You can navigate through the pages in the report by either clicking on the pages listed below, or by using the keyword search tool below to find specific information within the annual report.-
 1
1 -
 2
2 -
 3
3 -
 4
4 -
 5
5 -
 6
6 -
 7
7 -
 8
8 -
 9
9 -
 10
10 -
 11
11 -
 12
12 -
 13
13 -
 14
14 -
 15
15 -
 16
16 -
17
-
18
-
19
-
20
-
21
-
22
-
23
-
24
-
25
-
26
-
27
-
28
-
29
-
30
-
31
-
32
-
33
-
34
-
35
-
36
-
37
-
38
-
39
-
40
-
41
-
42
-
43
-
44
-
45
-
46
-
47
-
48
-
49
-
50
-
51
-
52
-
53
-
54
-
55
-
56
-
57
-
58
-
59
-
60
-
61
-
62
-
63
-
64
-
65
-
66
-
67
-
68
-
69
-
70
-
71
-
72
-
73
-
74
-
75
-
76
-
77
-
78
-
79
-
80
-
81
-
82
-
83
-
84
-
85
-
86
-
87
-
88
-
89
-
90
-
91
-
92
 |
 |

2008 2009 2010 2011
692.7
1.05
times
2012
0
200.0
400.0
600.0
800.0
1,000.0
800.8
925.2
729.5
675.8
0.80
times
1.44
times
0.92
times 0.89
times
2008 2009 2010 2011
162.0
5.3%
2012
0
100.0
200.0
300.0
400.0
7.6% 8.2% 7.7%
5.7%
352.2 346.5
276.0
176.5
2008 2009 2010 2011
42.0
2012
0
50.0
100.0
150.0
122.6
103.1
83.1
52.9
IT Services
Business
39.5
billion yen
Platform
Business
5.2
billion yen
Carrier Network
Business
56.1
billion yen
Social
Infrastructure
Business
16.2
billion yen Personal
Solutions
Business
1.0
billion yen
Others
7.1
billion yen
300.0
200.0
100.0
0
192.3
–135.8
27.4
–173.2
134.8
–41.2
33.7
–146.2
–200.0
–112.6
56.5
–145.8
93.6
2008 2009 2010 2011 2012
83.9
34.2
–49.7
IT Services Business
816.9 billion yen
(27%)
Platform
Business
372.4
billion yen
(12%)
Carrier Network
Business
633.0
billion yen
(21%)
Others
223.2 billion yen
(7%)
Personal Solutions
Business
661.0
billion yen
(22%)
Social
Infrastructure
Business
330.4
billion yen
(11%)
Fiscal 2012
net sales:
¥3,036.8 billion
Note: Expenses other than the above include
general and administrative expenses of divisions
that are not affiliated with any segment and basic
research and fundamental development expenses.
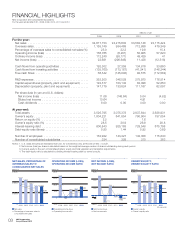
INTEREST-BEARING DEBT,
DEBT-EQUITY RATIO
(Billion ¥)
R&D EXPENSES,
R&D EXPENSES RATIO
(Billion ¥)
CAPITAL EXPENDITURES
(Billion ¥)
SEGMENT SALES (COMPOSITION)
CASH FLOWS
(Billion ¥)
SEGMENT OPERATING INCOME
Millions of
U.S. dollars Percent
change
2012/2011
2012 2012
¥3,036,836 $37,035 –2.5%
481,492 5,872 0.4
15.9
73,742 899 27.5
42,050 513 –
(110,267) (1,345) –
83,857 1,023 149.1
(49,706) (606) –
34,151 416 –
161,968 1,975 –8.2
41,980 512 –20.6
53,306 650 –14.2
(42.44) (0.52) –
– – –
0.00 0.00 –
2,557,570 31,190 –2.7
656,956 8,012 –13.2
–
25.7
692,734 8,448 2.5
1.05
109,102
265
R&D expenses
R&D expenses ratio
Cash flows from operating activities
Cash flows from investing activities
Free cash flows
Interest-bearing debt
Debt-equity ratio
(At year-end)
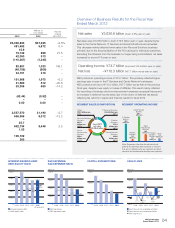
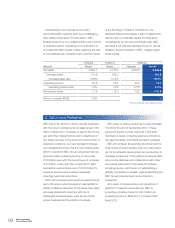
Overview of Business Results for the Fiscal Year
Ended March 2012
Net sales were ¥3,036.8 billion, down ¥78.6 billion year on year, despite higher
sales in the Carrier Network, IT Services and Social Infrastructure businesses.
This decrease mainly reflected lower sales in the Personal Solutions business
primarily due to the deconsolidation of the PC business for individual customers.
Excluding the influence from the business no longer being consolidated, net sales
increased by around 1% year on year.
NEC posted an operating income of ¥73.7 billion. This primarily reflected higher
earnings year on year in the IT Services and Carrier Network businesses.
NEC posted a net loss of ¥110.3 billion, ¥97.7 billion worse than in the previous
fiscal year, despite lower equity in losses of affiliates. This result mainly reflected
the recording of business structure improvement expenses as special losses and
an increase in deferred income taxes due to the review of deferred tax assets
reflecting tax reforms in Japan and financial results for fiscal 2012.
Net sales ¥3,036.8 billion (down 2.5% year on year)
Operating income ¥73.7 billion (improved ¥15.9 billion year on year)
Net loss –¥110.3 billion (¥97.7 billion worse year on year)
04
NEC Corporation
Annual Report 2012