Motorola 2002 Annual Report Download - page 23
Download and view the complete annual report
Please find page 23 of the 2002 Motorola annual report below. You can navigate through the pages in the report by either clicking on the pages listed below, or by using the keyword search tool below to find specific information within the annual report.-
 1
1 -
2
-
3
-
4
-
5
-
6
-
7
-
8
-
9
-
10
-
11
-
12
-
 13
13 -
 14
14 -
 15
15 -
 16
16 -
 17
17 -
 18
18 -
 19
19 -
 20
20 -
 21
21 -
 22
22 -
 23
23 -
 24
24 -
 25
25 -
 26
26 -
 27
27 -
 28
28 -
 29
29 -
 30
30 -
 31
31 -
 32
32 -
 33
33 -
34
-
35
-
36
-
37
-
38
-
39
-
40
-
41
-
42
-
43
-
44
-
45
-
46
-
47
-
48
 |
 |

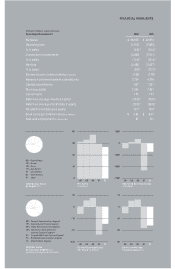
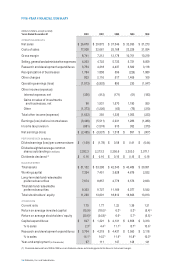
FINANCIAL HIGHLIGHTS
(Dollars in millions, except as noted)
Years Ended December 31 2002 2001
Net sales $ 26,679 $ 29,873
Operating loss (1,813) (5,803)
% to sales (6.8)%(19.4)%
Loss before income taxes (3,446) (5,511)
% to sales (12.9)%(18.4)%
Net loss (2,485) (3,937)
% to sales (9.3)%(13.2)%
Diluted loss per common share (in dollars) (1.09) (1.78)
Research and development expenditures 3,754 4,318
Capital expenditures 607 1,321
Working capital 7,324 7,451
Current ratio 1.75 1.77
Return on average invested capital (15.9)%(18.0)%
Return on average stockholders’ equity (20.6)%(24.8)%
Net debt to net debt plus equity 16.7%18.4%
Book value per common share (in dollars) $4.85 $ 6.07
Year-end employment (in thousands) 97 111
Net Sales
(in billions) Operating Earnings (Loss)
(in millions)
Diluted Earnings (Loss)
Per Share (in dollars) Return on Average
Invested Capital (%)
98
10
0-7500
20
30
40
-1.5
-2.25
-.75
0
.75
-20
-30
-10
0
10
-5000
-2500
0
2500
99 00 01 02
98 99 00 01 02 98 99 00 01 02
98 99 00 01 02
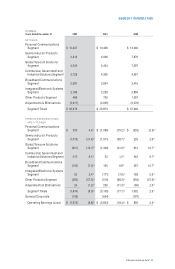
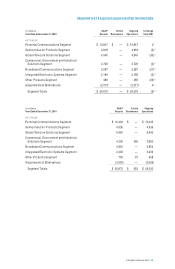
2002 Net Sales
by Business Segment (%)
(before intercompany eliminations)
2002 Market Sales
by Region (%)
38% Personal Communications Segment
17% Semiconductor Products Segment
16% Global Telecom Solutions Segment
13% Commercial, Government and
Industrial Solutions Segment
8% Integrated Electronic Systems Segment
7% Broadband Communications Segment
1% Other Products Segment
45% United States
14% Europe
14% China
11% Asia-Pacific
7% Latin America
6% Other Markets
3% Japan