Kohl's 2012 Annual Report Download - page 47
Download and view the complete annual report
Please find page 47 of the 2012 Kohl's annual report below. You can navigate through the pages in the report by either clicking on the pages listed below, or by using the keyword search tool below to find specific information within the annual report.-
 1
1 -
2
-
3
-
4
-
5
-
6
-
7
-
8
-
9
-
10
-
11
-
12
-
13
-
14
-
15
-
16
-
17
-
18
-
19
-
20
-
21
-
22
-
23
-
24
-
25
-
26
-
27
-
28
-
29
-
30
-
31
-
32
-
33
-
34
-
35
-
36
-
 37
37 -
 38
38 -
 39
39 -
 40
40 -
 41
41 -
 42
42 -
 43
43 -
 44
44 -
 45
45 -
 46
46 -
 47
47 -
 48
48 -
 49
49 -
 50
50 -
 51
51 -
 52
52 -
 53
53 -
 54
54 -
 55
55 -
 56
56 -
 57
57 -
58
-
59
-
60
-
61
-
62
-
63
-
64
-
65
-
66
-
67
-
68
-
69
-
70
-
71
-
72
-
73
-
74
-
75
-
76
-
77
-
78
-
79
-
80
-
81
-
82
-
83
-
84
-
85
-
86
-
87
-
88
-
89
-
90
-
91
-
92
-
93
-
94
-
95
-
96
-
97
-
98
-
99
-
100
-
101
-
102
-
103
-
104
-
105
-
106
-
107
-
108
-
109
-
110
-
111
-
112
-
113
-
114
-
115
-
116
-
117
-
118
-
119
-
120
-
121
-
122
-
123
-
124
-
125
-
126
-
127
-
128
-
129
-
130
-
131
-
132
-
133
-
134
-
135
-
136
-
137
-
138
-
139
-
140
-
141
-
142
-
143
-
144
-
145
-
146
-
147
-
148
-
149
-
150
-
151
-
152
-
153
-
154
-
155
-
156
-
157
-
158
-
159
-
160
-
161
-
162
-
163
-
164
 |
 |

KOHL’S CORPORATION
NOTES TO CONSOLIDATED FINANCIAL STATEMENTS—(Continued)
F-8
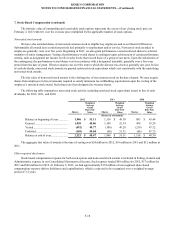
1. Business and Summary of Accounting Policies (continued)
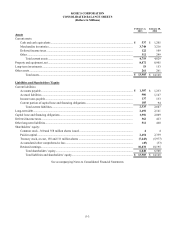
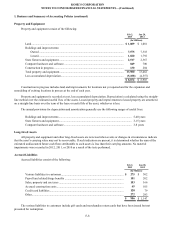
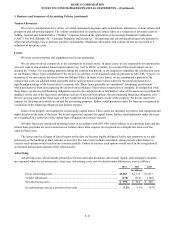
Property and Equipment
Property and equipment consist of the following:
Feb 2,
2013 Jan 28,
2012
(In Millions)
Land................................................................................................................................. $ 1,089 $ 1,081
Buildings and improvements:
Owned ...................................................................................................................... 7,575 7,318
Leased....................................................................................................................... 1,820 1,792
Store fixtures and equipment........................................................................................... 2,517 2,367
Computer hardware and software.................................................................................... 849 700
Construction in progress.................................................................................................. 130 204
Total property and equipment.......................................................................................... 13,980 13,462
Less accumulated depreciation........................................................................................ (5,108)(4,557)
$ 8,872 $ 8,905
Construction in progress includes land and improvements for locations not yet opened and for the expansion and
remodeling of existing locations in process at the end of each year.
Property and equipment is recorded at cost, less accumulated depreciation. Depreciation is calculated using the straight-
line method over the estimated useful lives of the assets. Leased property and improvements to leased property are amortized
on a straight-line basis over the term of the lease or useful life of the asset, whichever is less.
The annual provisions for depreciation and amortization generally use the following ranges of useful lives:
Buildings and improvements...................................................................................................... 5-40 years
Store fixtures and equipment...................................................................................................... 3-15 years
Computer hardware and software............................................................................................... 3-8 years
Long-Lived Assets
All property and equipment and other long-lived assets are reviewed when events or changes in circumstances indicate
that the asset’s carrying value may not be recoverable. If such indicators are present, it is determined whether the sum of the
estimated undiscounted future cash flows attributable to such assets is less than their carrying amounts. No material
impairments were recorded in 2012, 2011, or 2010 as a result of the tests performed.
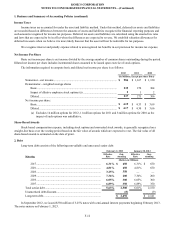
Accrued Liabilities
Accrued liabilities consist of the following:
Feb 2,
2013 Jan 28,
2012
(In Millions)
Various liabilities to customers....................................................................................... $ 275 $ 302
Payroll and related fringe benefits .................................................................................. 101 202
Sales, property and use taxes .......................................................................................... 153 166
Accrued construction costs ............................................................................................. 65 105
Credit card liabilities....................................................................................................... 120 79
Other................................................................................................................................ 272 293
$ 986 $ 1,147
The various liabilities to customers include gift cards and merchandise return cards that have been issued but not
presented for redemption.