Kohl's 2010 Annual Report Download - page 23
Download and view the complete annual report
Please find page 23 of the 2010 Kohl's annual report below. You can navigate through the pages in the report by either clicking on the pages listed below, or by using the keyword search tool below to find specific information within the annual report.-
 1
1 -
2
-
3
-
4
-
5
-
6
-
7
-
8
-
9
-
10
-
11
-
12
-
 13
13 -
 14
14 -
 15
15 -
 16
16 -
 17
17 -
 18
18 -
 19
19 -
 20
20 -
 21
21 -
 22
22 -
 23
23 -
 24
24 -
 25
25 -
 26
26 -
 27
27 -
 28
28 -
 29
29 -
 30
30 -
 31
31 -
 32
32 -
 33
33 -
34
-
35
-
36
-
37
-
38
-
39
-
40
-
41
-
42
-
43
-
44
-
45
-
46
-
47
-
48
-
49
-
50
-
51
-
52
-
53
-
54
-
55
-
56
-
57
-
58
-
59
-
60
-
61
-
62
-
63
-
64
-
65
-
66
-
67
-
68
-
69
-
70
-
71
-
72
-
73
-
74
-
75
-
76
 |
 |

Table of Contents
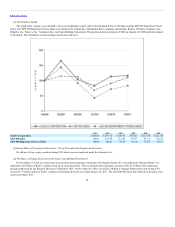
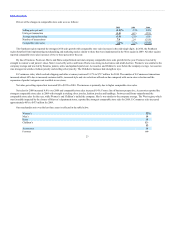
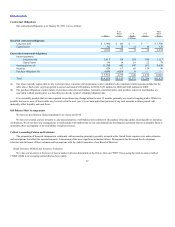
Drivers of the changes in comparable store sales were as follows:
Selling price per unit 2.3% 1.9%
Units per transaction (4.3) (2.9)
Average transaction value (2.0) (1.0)
Number of transactions 2.4 (5.9)
Comparable store sales 0.4% (6.9)%
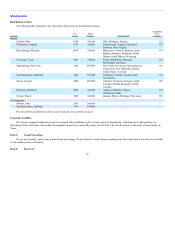
The Southeast region reported the strongest 2010 sales growth with comparable store sales increases in the mid-single digits. In 2010, the Southeast
region benefited from implementing merchandising and marketing tactics similar to those that were implemented in the West region in 2009. All other regions
reported comparable store sales increases of two to three percent for the year.
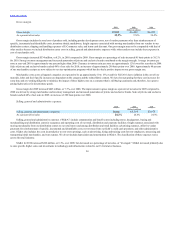
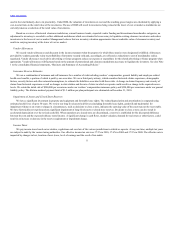
By line of business, Footwear, Men’s and Home outperformed our total company comparable store sales growth for the year. Footwear was led by
strength in women’s and juniors’ shoes. Men’s was led by active and basics. Home was strong in electronics and small electrics. Women’s was similar to the
company average and was led by Sonoma, juniors, active and updated sportswear. Accessories and Children’s were below the company average. Accessories
was strongest in watches, fashion jewelry and sterling silver jewelry. The Children’s business had strength in toys.
E-Commerce sales, which exclude shipping and other revenues, increased 51.7% to $717 million for 2010. The number of E-Commerce transactions
increased almost 60% due to increased customer traffic, increased style and size selections offered on-line compared with our in-store selection and the
expansion of product categories not available in our stores.
Net sales per selling square foot increased $5 to $222 in 2010. The increase is primarily due to higher comparable store sales.
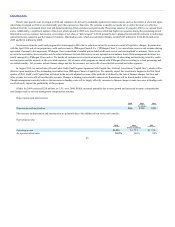
Net sales for 2009 increased 4.8% over 2008 and comparable store sales increased 0.4%. From a line of business perspective, Accessories reported the
strongest comparable store sales in 2009 with strength in sterling silver jewelry, fashion jewelry and handbags. Footwear and Home outperformed the
comparable store sales for the year, while Women’s and Children’s trailed the company. Men’s was similar to the company average. The West region, which
was favorably impacted by the closure of Mervyn’s department stores, reported the strongest comparable store sales for 2009. E-Commerce sales increased
approximately 40% to $473 million for 2009.
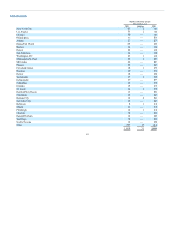
Our merchandise mix over the last three years is reflected in the table below:
Women’s
Men’s
Home
Children’s
Accessories
Footwear
23