Kohl's 2002 Annual Report Download - page 17
Download and view the complete annual report
Please find page 17 of the 2002 Kohl's annual report below. You can navigate through the pages in the report by either clicking on the pages listed below, or by using the keyword search tool below to find specific information within the annual report.-
 1
1 -
2
-
3
-
4
-
5
-
6
-
 7
7 -
 8
8 -
 9
9 -
 10
10 -
 11
11 -
 12
12 -
 13
13 -
 14
14 -
 15
15 -
 16
16 -
 17
17 -
 18
18 -
 19
19 -
 20
20
 |
 |
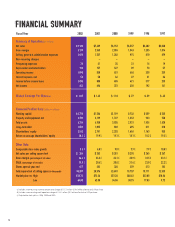
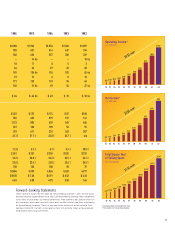
Fiscal Year 2002 2001 2000 1999 1998 1997
Summary of Operations
(In millions)
Net sales $9,120 $7,489 $6,152 $4,557 $3,682 $3,060
Gross margin 3,139 2,565 2,096 1,543 1,235 1,014
Selling, general & administrative expenses 1,818 1,527 1,282 975 810 679
Non-recurring charges -–––––
Preopening expenses 39 31 35 31 16 19
Depreciation and amortization 192 157 127 89 70 57
Operating income 1,090 850 651 448 338 259
Interest expense, net 56 50 46 27 21 24
Income before income taxes 1,034 800 605 421 317 235
Net income 643 496 372 258 192 141
Diluted Earnings Per Share(c) $1.87 $1.45 $ 1.10 $ .77 $ .59 $ .45
Financial Position Data
(Dollars in millions)
Working capital $1,776 $1,584 $1,199 $ 732 $ 559 $ 525
Property and equipment, net 2,739 2,199 1,727 1,353 933 750
Total assets 6,316 4,930 3,855 2,931 1,936 1,620
Long-term debt 1,059 1,095 803 495 311 310
Shareholders’ equity 3,512 2,791 2,203 1,686 1,163 955
Return on average shareholders’ equity 20.4 % 19.9 % 19.1 % 18.1 % 18.2 % 19.2 %
Other Data
Comparable store sales growth 5.3 % 6.8 % 9.0 % 7.9 % 7.9 % 10.0 %
Net sales per selling square foot $284 $ 283 $ 281 $ 270 $ 265 $ 267
Gross margin (percentage of net sales) 34.4 % 34.3 % 34.1 % 33.9 % 33.5 % 33.1 %
SG&A (percentage of net sales) 19.9 % 20.4 % 20.8 % 21.4 % 22.0 % 22.2 %
Stores open at year end 457 382 320 259 213 182
Total square feet of selling space (In thousands) 34,507 28,576 23,610 18,757 15,111 12,533
Market price (c): High $78.74 $72.24 $72.20 $40.63 $33.88 $18.84
Low 44.00 42.00 34.06 30.75 17.03 9.72
(a) Includes a non-recurring incentive compensation charge of $17.7 million ($10.6 million after-tax) or $.04 per share.
(b) Includes a non-recurring credit operations charge of $14.1 million ($8.3 million after-tax) or $.03 per share.
(c) Adjusted for stock splits in 1996, 1998 and 2000.
14
FINANCIAL SUMMARY