Kenwood 2002 Annual Report Download - page 17
Download and view the complete annual report
Please find page 17 of the 2002 Kenwood annual report below. You can navigate through the pages in the report by either clicking on the pages listed below, or by using the keyword search tool below to find specific information within the annual report.-
 1
1 -
2
-
3
-
4
-
5
-
6
-
 7
7 -
 8
8 -
 9
9 -
 10
10 -
 11
11 -
 12
12 -
 13
13 -
 14
14 -
 15
15 -
 16
16 -
 17
17 -
 18
18 -
 19
19 -
 20
20 -
 21
21 -
 22
22 -
 23
23 -
 24
24 -
 25
25 -
 26
26 -
 27
27 -
28
-
29
-
30
-
31
-
32
-
33
-
34
-
35
-
36
 |
 |

KENWOOD Corporation Annual Report 2002 15
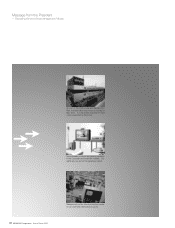
reacting to the market demand for smaller and lighter terminals
with a compact mobile terminal (for vehicles) with a built-in DC
converter and a lithium-ion battery operated handy terminal.
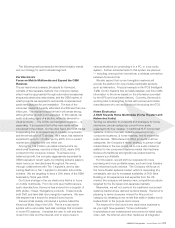
Financial Position
Assets and Liabilities
At the end of March 2002, total assets of the Kenwood Group
amounted to 182.9 billion yen, down 12.2% from the previous
year. Current assets decreased by 10.8% to 132.2 billion yen,
mainly due to the efforts spent throughout the Company in
reducing inventories. Fixed assets decreased by 3.1% to 32.7
billion yen and investments and other assets decreased 32% to
18.0 billion yen, due mainly to the selling and revaluation of
investment securities.
Despite accounts payable being reduced, current liabilities were
up by 3.2% and amounted to 168.9 billion yen as a result of
setting off 10.0 billion yen for the provision for loss on business
restructuring as explained earlier. A reduction in long-term
borrowings led to a 28.5% reduction in long-term liabilities to
30.6 billion yen, while added reserve was made for employees’
retirement allowances.
Cash Flows
Cash and cash equivalents outstanding at the end of the term
under review were 21.7 billion yen, an increase of 0.8 billion
from the previous year.
Cash flows from operating activities improved 22.6 billion yen
compared to the previous year and the Company reported an
income of 15.2 billion yen, thanks to reductions in accounts
receivable and inventories. Cash flows from investing activities
ended up in net spending of 8.0 billion yen, 3.2 billion yen more
than the previous year, as proceeds from the sale of investment
securities were canceled out by the purchase of tangible fixed
assets and software. Meanwhile, despite money being raised
by issuing new stock, the repayment of long-term borrowings
resulted in net spending of 6.8 billion yen in financing activities,
compared to 12.7 billion yen gained in the previous year.
Capital Expenditure
Total capital expenditure for the term ended March 2002
decreased by 10.3% from the previous year to 12.4 billion yen.
The majority was spent in purchases of tools and dies for new
products.
Financial Indicators
The deficit in working capital at the end of the financial year was
36.6 billion yen. The current ratio was 78.3% (90.6% for the
previous year). The shareholders’ equity ratio was negative
9.3% (0.7% for the previous year) and the asset turnover rate
was 1.65 times (1.46 for the previous year).
Total Shareholder's Equity
(20) (10) 30
2002
2001
2000
1999
1998
01020
Total Assets
0 100 15050 200
2002
2001
2000
1999
1998
2002
2001
2000
1999
1998
(10) 20
Equity Ratio
100
(Billions of yen) (Billions of yen) (%)