Kenwood 2000 Annual Report Download - page 17
Download and view the complete annual report
Please find page 17 of the 2000 Kenwood annual report below. You can navigate through the pages in the report by either clicking on the pages listed below, or by using the keyword search tool below to find specific information within the annual report.-
 1
1 -
2
-
3
-
4
-
5
-
6
-
 7
7 -
 8
8 -
 9
9 -
 10
10 -
 11
11 -
 12
12 -
 13
13 -
 14
14 -
 15
15 -
 16
16 -
 17
17 -
 18
18 -
 19
19 -
 20
20 -
 21
21 -
 22
22 -
 23
23 -
 24
24 -
 25
25 -
 26
26 -
 27
27 -
28
-
29
-
30
-
31
-
32
 |
 |

the end of March 2000. Total current assets decreased 5.1%
to
¥
130.2 billion as a result of our efforts to hold down the
total amount in accounts receivable and inventories.
Property, plant and equipment, at cost, less accumulated
depreciation, on the other hand, increased 6.2% from the
previous year to
¥
36.1 billion thanks largely to revaluation
of land values. Investments and other assets were
¥
46.2
billion, an increase of 9.7% from the previous year. The
recognition of deferred tax assets, investments in software,
and a rise in translation adjustment all contributed to the
increase. Meanwhile, the reduction in short-term debt led
to a 6.7% decrease in current liabilities, which stood at
¥
135.8
billion. Long-term liabilities increased 17% from the previous
year to
¥
40.8 billion. Major reasons for the increase were
recognition of deferred tax liabilities for revaluation and
expanded long-term borrowings. As a whole, total
shareholders' equity increased 9.4% from the previous year
to
¥
35.3 billion as a result of revaluation of land values.
The balance of cash and cash equivalents at the end of the
fiscal term increased
¥
4.8 billion from
¥
13.7 billion in
1999 and was
¥
18.5 billion. Net cash provided by
operating activities was
¥
16.8 billion thanks to reductions
in notes and accounts receivable and in inventories, as
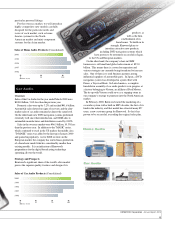
Total Assets
(Billions of yen)
1996
1997
1998
1999
2000
080 160 240 020 40
Total Shareholders' Equity
(Billions of yen) (%)
1996
1997
1998
1999
010 20
1996
1997
1998
1999
2000
2000
Cash Flows
Equity Ratio
KENWOOD Corporation Annual Report 2000
15
well as the increase in accounts payable. Net cash used
in investing activities was
¥
9.2 billion due to purchases of
tangible fixed assets and software. In financing activities,
increased payment of short and long-term borrowings led
to a net spending of
¥
1.7 billion
Total capital expenditures during the term under review
were ¥11.0 billion, an increase of 6.9% from the
previous year, of which a majority was spent for obtaining
metal dies for new products.
At the end of March 2000, the shortage in working capital
was
¥
5.6 billion. The current ratio was 0.96 (0.94 in
1999). The shareholders' equity ratio was 16.6% (15.1%
in 1999) and asset turnover rate was 1.29 times (1.45 times
in 1999).
Capital Expenditures
Financial Indicators