Kentucky Fried Chicken 2014 Annual Report Download - page 82
Download and view the complete annual report
Please find page 82 of the 2014 Kentucky Fried Chicken annual report below. You can navigate through the pages in the report by either clicking on the pages listed below, or by using the keyword search tool below to find specific information within the annual report.-
 1
1 -
2
-
3
-
4
-
5
-
6
-
7
-
8
-
9
-
10
-
11
-
12
-
13
-
14
-
15
-
16
-
17
-
18
-
19
-
20
-
21
-
22
-
23
-
24
-
25
-
26
-
27
-
28
-
29
-
30
-
31
-
32
-
33
-
34
-
35
-
36
-
37
-
38
-
39
-
40
-
41
-
42
-
43
-
44
-
45
-
46
-
47
-
48
-
49
-
50
-
51
-
52
-
53
-
54
-
55
-
56
-
57
-
58
-
59
-
60
-
61
-
62
-
63
-
64
-
65
-
66
-
67
-
68
-
69
-
70
-
71
-
 72
72 -
 73
73 -
 74
74 -
 75
75 -
 76
76 -
 77
77 -
 78
78 -
 79
79 -
 80
80 -
 81
81 -
 82
82 -
 83
83 -
 84
84 -
 85
85 -
 86
86 -
 87
87 -
 88
88 -
 89
89 -
 90
90 -
 91
91 -
 92
92 -
93
-
94
-
95
-
96
-
97
-
98
-
99
-
100
-
101
-
102
-
103
-
104
-
105
-
106
-
107
-
108
-
109
-
110
-
111
-
112
-
113
-
114
-
115
-
116
-
117
-
118
-
119
-
120
-
121
-
122
-
123
-
124
-
125
-
126
-
127
-
128
-
129
-
130
-
131
-
132
-
133
-
134
-
135
-
136
-
137
-
138
-
139
-
140
-
141
-
142
-
143
-
144
-
145
-
146
-
147
-
148
-
149
-
150
-
151
-
152
-
153
-
154
-
155
-
156
-
157
-
158
-
159
-
160
-
161
-
162
-
163
-
164
-
165
-
166
-
167
-
168
-
169
-
170
-
171
-
172
-
173
-
174
-
175
-
176
 |
 |

15MAR201511093851
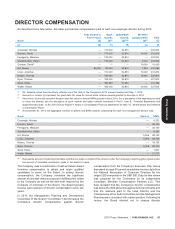
If a change in control and each NEO’s involuntary termination had occurred as of December 31, 2014, the following payments or
other benefits would have been made or become available.
Severance Payment $ 7,540,000 $ 2,860,000 $ 4,730,000 $4,523,250 $2,900,000
Annual Incentive 2,320,000 715,000 1,265,000 1,511,625 725,000
Accelerated Vesting of Stock Options and SARs 7,885,976 3,208,794 2,689,878 2,083,063 1,609,157
Accelerated Vesting of RSUs — 1,216,024 13,633,878 — —
Acceleration of PSU Performance/Vesting 2,212,622 234,374 493,299 313,610 260,138
Outplacement 25,000 25,000 25,000 25,000 25,000
TOTAL 19,983,598 8,259,192 22,837,055 8,456,548 5,519,295
If a change in control without an involuntary termination had occurred as of December 31, 2014, the following benefits would have
become available.
Accelerated Vesting of Stock Options and SARs $ 4,508,371 $ 1,998,691 $ 1,535,339 $1,067,441 $ 792,381
Accelerated Vesting of RSUs — 1,216,024 13,633,878 — —
Acceleration of PSU Performance/Vesting — — — — —
TOTAL 4,508,371 3,214,715 15,169,217 1,067,441 792,381
60 YUM! BRANDS, INC. 2015 Proxy Statement
Novak Grismer Su Creed Bergren
$$$$$
Novak Grismer Su Creed Bergren
$$$$$
EXECUTIVE COMPENSATION
Proxy Statement