Kentucky Fried Chicken 2001 Annual Report Download - page 25
Download and view the complete annual report
Please find page 25 of the 2001 Kentucky Fried Chicken annual report below. You can navigate through the pages in the report by either clicking on the pages listed below, or by using the keyword search tool below to find specific information within the annual report.-
 1
1 -
2
-
3
-
4
-
5
-
6
-
7
-
8
-
9
-
10
-
11
-
12
-
13
-
14
-
 15
15 -
 16
16 -
 17
17 -
 18
18 -
 19
19 -
 20
20 -
 21
21 -
 22
22 -
 23
23 -
 24
24 -
 25
25 -
 26
26 -
 27
27 -
 28
28 -
 29
29 -
 30
30 -
 31
31 -
 32
32 -
 33
33 -
 34
34 -
 35
35 -
36
-
37
-
38
-
39
-
40
-
41
-
42
-
43
-
44
-
45
-
46
-
47
-
48
-
49
-
50
-
51
-
52
-
53
-
54
-
55
-
56
-
57
-
58
-
59
-
60
-
61
-
62
-
63
-
64
-
65
-
66
-
67
-
68
-
69
-
70
-
71
-
72
 |
 |
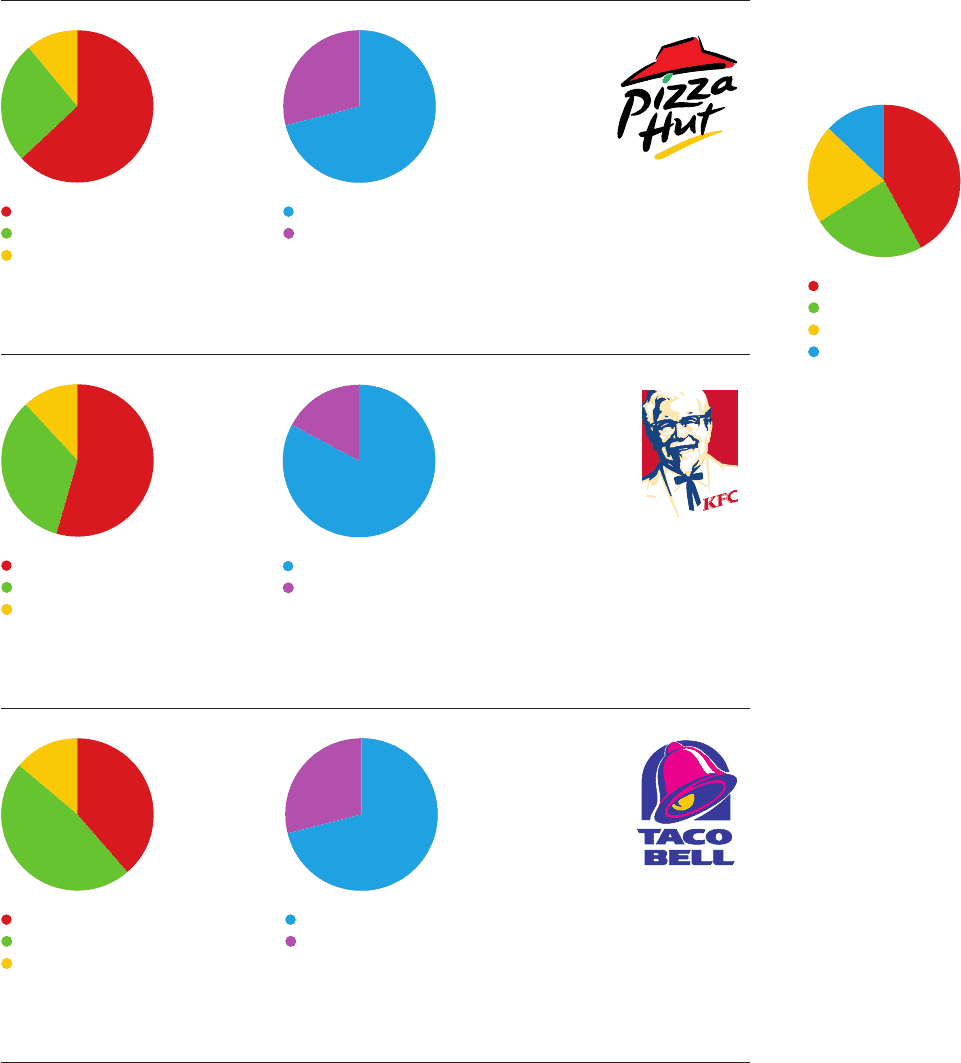
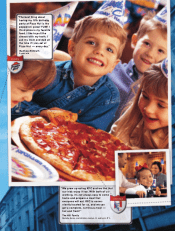
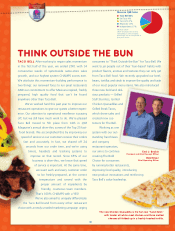
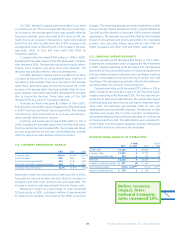
Sales across our
brands are driven
by dinner and
lunch. Marketing
innovations such as
new dayparts can
help grow sales.
Most of our sales
come from off-
premises dining,
which reflects
customers’ desire
for convenient
food.
23
Asia-Pacific 42%
Europe, South Africa 24%
Americas 21%
Greater China 13%
Sources of System Sales in
International Restaurants
Dinner 63%
Lunch 26%
Snacks/Breakfast 11%
U.S. Sales by
Daypart (% of Sales)
U.S. Sales by Distribution
Channel (% of Sales)
Dine Out 71%
Dine In 29%
Dinner 55%
Lunch 34%
Snacks/Breakfast 11%
Dine Out 82%
Dine In 18%
Dinner 39%
Lunch 48%
Snacks/Breakfast 13%
Dine Out 71%
Dine In 29%
TM
®
®
SOURCE: CREST
CREST employed new tracking
methodology in 2001, therefore
percentages are not comparable to
prior years’ results.