JP Morgan Chase 2010 Annual Report Download - page 2
Download and view the complete annual report
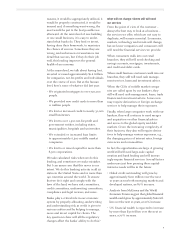
Please find page 2 of the 2010 JP Morgan Chase annual report below. You can navigate through the pages in the report by either clicking on the pages listed below, or by using the keyword search tool below to find specific information within the annual report.-
 1
1 -
 2
2 -
 3
3 -
 4
4 -
 5
5 -
 6
6 -
 7
7 -
 8
8 -
 9
9 -
 10
10 -
 11
11 -
 12
12 -
 13
13 -
14
-
15
-
16
-
17
-
18
-
19
-
20
-
21
-
22
-
23
-
24
-
25
-
26
-
27
-
28
-
29
-
30
-
31
-
32
-
33
-
34
-
35
-
36
-
37
-
38
-
39
-
40
-
41
-
42
-
43
-
44
-
45
-
46
-
47
-
48
-
49
-
50
-
51
-
52
-
53
-
54
-
55
-
56
-
57
-
58
-
59
-
60
-
61
-
62
-
63
-
64
-
65
-
66
-
67
-
68
-
69
-
70
-
71
-
72
-
73
-
74
-
75
-
76
-
77
-
78
-
79
-
80
-
81
-
82
-
83
-
84
-
85
-
86
-
87
-
88
-
89
-
90
-
91
-
92
-
93
-
94
-
95
-
96
-
97
-
98
-
99
-
100
-
101
-
102
-
103
-
104
-
105
-
106
-
107
-
108
-
109
-
110
-
111
-
112
-
113
-
114
-
115
-
116
-
117
-
118
-
119
-
120
-
121
-
122
-
123
-
124
-
125
-
126
-
127
-
128
-
129
-
130
-
131
-
132
-
133
-
134
-
135
-
136
-
137
-
138
-
139
-
140
-
141
-
142
-
143
-
144
-
145
-
146
-
147
-
148
-
149
-
150
-
151
-
152
-
153
-
154
-
155
-
156
-
157
-
158
-
159
-
160
-
161
-
162
-
163
-
164
-
165
-
166
-
167
-
168
-
169
-
170
-
171
-
172
-
173
-
174
-
175
-
176
-
177
-
178
-
179
-
180
-
181
-
182
-
183
-
184
-
185
-
186
-
187
-
188
-
189
-
190
-
191
-
192
-
193
-
194
-
195
-
196
-
197
-
198
-
199
-
200
-
201
-
202
-
203
-
204
-
205
-
206
-
207
-
208
-
209
-
210
-
211
-
212
-
213
-
214
-
215
-
216
-
217
-
218
-
219
-
220
-
221
-
222
-
223
-
224
-
225
-
226
-
227
-
228
-
229
-
230
-
231
-
232
-
233
-
234
-
235
-
236
-
237
-
238
-
239
-
240
-
241
-
242
-
243
-
244
-
245
-
246
-
247
-
248
-
249
-
250
-
251
-
252
-
253
-
254
-
255
-
256
-
257
-
258
-
259
-
260
-
261
-
262
-
263
-
264
-
265
-
266
-
267
-
268
-
269
-
270
-
271
-
272
-
273
-
274
-
275
-
276
-
277
-
278
-
279
-
280
-
281
-
282
-
283
-
284
-
285
-
286
-
287
-
288
-
289
-
290
-
291
-
292
-
293
-
294
-
295
-
296
-
297
-
298
-
299
-
300
-
301
-
302
-
303
-
304
-
305
-
306
-
307
-
308
 |
 |

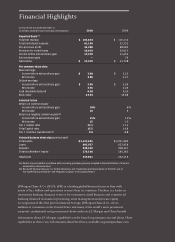
As of or for the year ended December 31,
(in millions, except per share, ratio data and headcount) 2010 2009
Reported basis(a)
Total net revenue $ 102,694 $ 100,434
Total noninterest expense 61,196 52,352
Pre-provision profit 41,498 48,082
Provision for credit losses 16,639 32,015
Income before extraordinary gain 17,370 11,652
Extraordinary gain — 76
Net income $ 17,370 $ 11,728
Per common share data
Basic earnings
Income before extraordinary gain $ 3.98 $ 2.25
Net income 3.98 2.27
Diluted earnings
Income before extraordinary gain $ 3.96 $ 2.24
Net income 3.96 2.26
Cash dividends declared 0.20 0.20
Book value 43.04 39.88
Selected ratios
Return on common equity
Income before extraordinary gain 10% 6 %
Net income 10 6
Return on tangible common equity(b)
Income before extraordinary gain 15% 10 %
Net income 15 10
Tier 1 Capital ratio 12.1 11.1
Total Capital ratio 15.5 14.8
Tier 1 Common Capital ratio(b) 9.8 8.8
Selected balance sheet data (period-end)
Total assets $ 2,117,605 $ 2,031,989
Loans 692,927 633,458
Deposits 930,369 938,367
Total stockholders’ equity 176,106 165,365
Headcount 239,831 222,316
(a) Results are presented in accordance with accounting principles generally accepted in the United States of America,
except where otherwise noted.
(b) Non-GAAP financial measure. For further discussion, see “Explanation and reconciliation of the firm’s use of
non-GAAP financial measures” and “Regulatory capital” in this Annual Report.
Financial Highlights
JPMorgan Chase & Co. (NYSE: JPM) is a leading global financial services firm with
assets of $2.1 trillion and operations in more than 60 countries. The firm is a leader in
investment banking, financial services for consumers, small business and commercial
banking, financial transaction processing, asset management and private equity.
A component of the Dow Jones Industrial Average, JPMorgan Chase & Co. serves
millions of consumers in the United States and many of the world’s most prominent
corporate, institutional and government clients under its J.P. Morgan and Chase brands.
Information about J.P. Morgan capabilities can be found at jpmorgan.com and about Chase
capabilities at chase.com. Information about the firm is available at jpmorganchase.com.
Rev1_11-0309_AR10_IFC_IBC_UG.indd 1 4/4/11 9:49 PM