JCPenney 2012 Annual Report Download - page 101
Download and view the complete annual report
Please find page 101 of the 2012 JCPenney annual report below. You can navigate through the pages in the report by either clicking on the pages listed below, or by using the keyword search tool below to find specific information within the annual report.-
 1
1 -
2
-
3
-
4
-
5
-
6
-
7
-
8
-
9
-
10
-
11
-
12
-
13
-
14
-
15
-
16
-
17
-
18
-
19
-
20
-
21
-
22
-
23
-
24
-
25
-
26
-
27
-
28
-
29
-
30
-
31
-
32
-
33
-
34
-
35
-
36
-
37
-
38
-
39
-
40
-
41
-
42
-
43
-
44
-
45
-
46
-
47
-
48
-
49
-
50
-
51
-
52
-
53
-
54
-
55
-
56
-
57
-
58
-
59
-
60
-
61
-
62
-
63
-
64
-
65
-
66
-
67
-
68
-
69
-
70
-
71
-
72
-
73
-
74
-
75
-
76
-
77
-
78
-
79
-
80
-
81
-
82
-
83
-
84
-
85
-
86
-
87
-
88
-
89
-
90
-
 91
91 -
 92
92 -
 93
93 -
 94
94 -
 95
95 -
 96
96 -
 97
97 -
 98
98 -
 99
99 -
 100
100 -
 101
101 -
 102
102 -
 103
103 -
 104
104 -
 105
105 -
 106
106 -
 107
107 -
 108
108
 |
 |
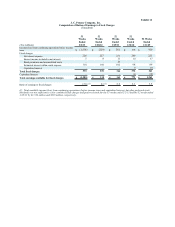
Exhibit 12
J. C. Penney Company, Inc.
Computation of Ratios of Earnings to Fixed Charges
53
Weeks 52
Weeks 52
Weeks 52
Weeks 52 Weeks
Ended Ended Ended Ended Ended
($ in millions) 2/2/13 1/28/12 1/29/11 1/30/10 1/31/09
Total fixed charges 333 339 364 372 361
Total earnings available for fixed charges $(1,203) $110 $945 $771 $1,261
(1) Total available income/(loss) from continuing operations (before income taxes and capitalized interest, but after preferred stock
dividend) was not sufficient to cover combined fixed charges and preferred stock for the 53 weeks ended 2/2/13 and the 52 weeks ended
1/28/12 by $1,536 million and $229 million, respectively.