Isuzu 2016 Annual Report Download - page 4
Download and view the complete annual report
Please find page 4 of the 2016 Isuzu annual report below. You can navigate through the pages in the report by either clicking on the pages listed below, or by using the keyword search tool below to find specific information within the annual report.-
 1
1 -
 2
2 -
 3
3 -
 4
4 -
 5
5 -
 6
6 -
 7
7 -
 8
8 -
 9
9 -
 10
10 -
 11
11 -
 12
12 -
 13
13 -
 14
14 -
 15
15 -
16
-
17
-
18
-
19
-
20
-
21
-
22
-
23
-
24
-
25
-
26
-
27
-
28
-
29
-
30
-
31
-
32
-
33
-
34
-
35
-
36
-
37
-
38
-
39
-
40
-
41
-
42
 |
 |

2
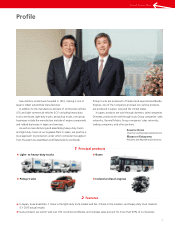
Isuzu Motors Limited
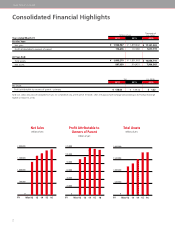
Net Sales
(Millions of yen)
Profit Attributable to
Owners of Parent
(Millions of yen)
Total Assets
(Millions of yen)
Millions of yen
Thousands of
U.S. dollars
Note: U.S. dollar amounts are translated from yen, for convenience only, at the rate of ¥112.68 = US$1; the approximate exchange rate prevailing on the Foreign Exchange
Market on March 31, 2016.
Consolidated Financial Highlights
Yen U.S. dollars
Year ended March 31 2016 2015 2016
For the Year:
Net sales
Profit attributable to owners of parent
At Year-End:
Total assets
Net assets
2016 2015 2016
Per Share:
Profit attributable to owners of parent – primary
$ 17,101,233
1,017,719
$ 16,056,710
7,966,365
¥ 1,879,442
117,060
¥ 1,801,918
914,451
¥ 1,926,967
114,676
¥ 1,809,270
897,650
$ 1.22
¥ 139.34
¥ 138.43