Isuzu 2013 Annual Report Download - page 4
Download and view the complete annual report
Please find page 4 of the 2013 Isuzu annual report below. You can navigate through the pages in the report by either clicking on the pages listed below, or by using the keyword search tool below to find specific information within the annual report.-
 1
1 -
 2
2 -
 3
3 -
 4
4 -
 5
5 -
 6
6 -
 7
7 -
 8
8 -
 9
9 -
 10
10 -
 11
11 -
 12
12 -
 13
13 -
 14
14 -
 15
15 -
16
-
17
-
18
-
19
-
20
-
21
-
22
-
23
-
24
-
25
-
26
-
27
-
28
-
29
-
30
-
31
-
32
-
33
-
34
-
35
-
36
-
37
-
38
-
39
-
40
 |
 |

02
Isuzu Motors Limited
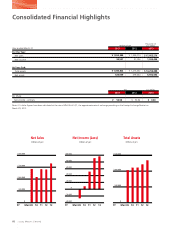
Net Sales
(Millions of yen)
Net Income (Loss)
(Millions of yen)
Total Assets
(Millions of yen)
Millions of yen
Thousands of
U.S. dollars
Note: U.S. dollar figures have been calculated at the rate of ¥94.05=U.S.$1, the approximate rate of exchange prevailing on the Foreign Exchange Market on
March 29, 2013.
Consolidated Financial Highlights
Yen U.S. dollars
Year ended March 31
2013
2012
2013
For the Year:
Net sales
Net income
At Year-End:
Total assets
Net assets
2013
2012
2013
Per Share:
Net income – primary
$
17
,
603
,
276
1
,
026
,
444
$
14
,
256
,
488
6
,
602
,
442
¥ 1,400,074
91,256
¥ 1,213,402
479,644
¥
1
,
655
,
588
96
,
537
¥
1
,
340
,
822
620
,
959
$
0
.
60
¥ 53.86
¥
56
.
98