Intel 2011 Annual Report Download - page 2
Download and view the complete annual report
Please find page 2 of the 2011 Intel annual report below. You can navigate through the pages in the report by either clicking on the pages listed below, or by using the keyword search tool below to find specific information within the annual report.-
 1
1 -
 2
2 -
 3
3 -
 4
4 -
 5
5 -
 6
6 -
 7
7 -
 8
8
 |
 |

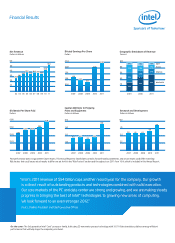
“ Intel’s 2011 revenue of $54 billion caps another record year for the company. Our growth
is a direct result of outstanding products and technologies combined with solid execution.
Our core markets of the PC and data center are strong and growing, and we are making steady
progress in bringing the best of Intel® technologies to growing new areas of computing.
We look forward to an even stronger 2012.”
Paul S. Otellini, President and Chief Executive Offi cer
Financial Results
On the cover: The 3rd generation Intel® Core™ processor family, built using 22-nanometer process technology with 3-D Tri-Gate transistors, delivers energy-effi cient
performance that will help shape the computing era ahead.
26.8
60
2.5
5.0
7. 5
10.0
0.20
0.60
0.80
10
30
20
40
50
3.0
6.0
9.0
12.0
21%
19 %
49%
11%
21%
13 %
57%
9%
35%
25%
31%
9%
100908070605040302 201120062001
5.8 5.7
6.6
5.7
5.0
10. 8
5.2
4.5
5.2
20102009
8.4
Geographic Breakdown of Revenue
Percent
Net Revenue
Dollars in billions
Diluted Earnings Per Share
Dollars
Capital Additions to Property,
Plant and Equipment
Dollars in billions
Research and Development
Dollars in billions
Dividends Per Share Paid
Dollars
Japan
11
0.40
0.55
0.63
0.78
1.18
0.77
2011
2.01
2.39
0.92
20082007
20102009 201120082007 20102009 201120082007 20102009 201120082007
0.50
1. 0 0
1. 5 0
2.50
2.00
20
40
60
80
100
Americas
Europe
$VLD3DFLÀF
30.1
35.4 37.6 35.1
0.56
34.2
38.8 38.3
43.6
54.0
0.45
Past performance does not guarantee future results. This Annual Report to Stockholders contains forward-looking statements, and actual results could differ materially.
Risk factors that could cause actual results to differ are set forth in the “Risk Factors” section and throughout our 2011 Form 10-K, which is included in this Annual Report.