Ingram Micro 2008 Annual Report Download - page 3
Download and view the complete annual report
Please find page 3 of the 2008 Ingram Micro annual report below. You can navigate through the pages in the report by either clicking on the pages listed below, or by using the keyword search tool below to find specific information within the annual report.-
 1
1 -
 2
2 -
 3
3 -
 4
4 -
 5
5 -
 6
6 -
 7
7 -
 8
8 -
 9
9 -
 10
10 -
 11
11 -
 12
12 -
 13
13 -
 14
14 -
15
-
16
-
17
-
18
-
19
-
20
-
21
-
22
-
23
-
24
-
25
-
26
-
27
-
28
-
29
-
30
-
31
-
32
-
33
-
34
-
35
-
36
-
37
-
38
-
39
-
40
-
41
-
42
-
43
-
44
-
45
-
46
-
47
-
48
-
49
-
50
-
51
-
52
-
53
-
54
-
55
-
56
-
57
-
58
-
59
-
60
-
61
-
62
-
63
-
64
-
65
-
66
-
67
-
68
-
69
-
70
-
71
-
72
-
73
-
74
-
75
-
76
-
77
-
78
-
79
-
80
-
81
-
82
-
83
-
84
-
85
-
86
-
87
-
88
-
89
-
90
-
91
-
92
-
93
-
94
-
95
-
96
-
97
-
98
-
99
-
100
 |
 |

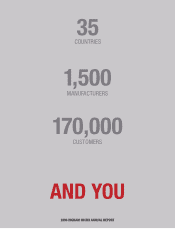
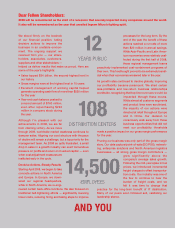
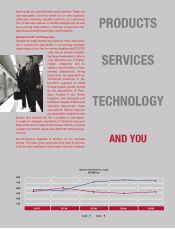
AND YOU
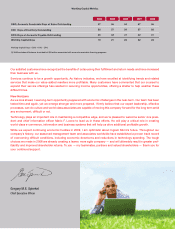
Dear Fellow Shareholders:
2008 will be remembered as the start of a recession that severely impacted many companies around the world.
It also will be remembered as the year that unveiled Ingram Micro’s fighting spirit.
We stood firmly on the bedrock
of our financial position, taking
decisive actions to improve the
business in an unstable environ-
ment. The ongoing support we
received from you — our share-
holders, associates, customers,
suppliers and other stakeholders —
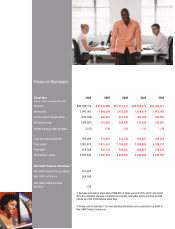
helped us deliver results that make us proud. Here are
some of the year’s highlights:
• Sales topped $34 billion, the second-highest level in
our history
• Gross margins were at the highest level in 10 years
• Excellent management of working capital helped
generate operating cash flow of more than $550 million
for the year
• Year-end cash balance peaked to
a record amount of $763 million,
even after repurchasing $222
million in company stock during
the year.
Although I’m pleased with our
achievements in 2008, we are far
from claiming victory. As we move
through 2009, worldwide market weakness continues to
dampen sales. Aligning our cost structure with the pace
of decline will remain a challenge, but a top priority for the
management team. As 2008 so aptly illustrated, a small
drop in sales in a growth industry can exert tremendous
pressure on profits and return on invested capital — even
when cost adjustment measures are
instituted early in the cycle.
Decisive Actions, Steady Results
Starting April 2008, we began to take
concrete actions in North America
and Europe. In Europe, we down-
sized our regional headquarters,
while in North America, we re-engi-
neered certain back-office functions. We also focused on
traditional belt-tightening efforts — significantly lowering
travel costs, reducing hiring and taking steps to improve
processes for the long term. By the
end of the year, the benefit of these
actions reached a run-rate of more
than $20 million in annual savings.
While Asia-Pacific and Latin Amer-
ican economies were relatively unaf-
fected during the first half of 2008,
those regional management teams
proactively implemented cost-containment programs of
their own. This forethought proved to be extremely benefi-
cial when their economies worsened later in the year.
As growth rates continued to decline globally, improving
our profitability became paramount. We shed certain
less-profitable and low-return business relationships
worldwide, recognizing that top-line revenues would be
impacted through these moves.
While almost all customer segments
and product lines were scrutinized,
the majority of our actions were
directed at retail throughout Europe
and in China. Our decision to
consciously walk away from those
business opportunities that did not
meet our profitability thresholds
made a positive impact on our gross margin performance
for the year.
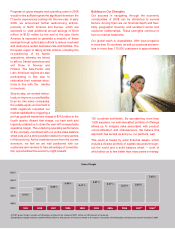
Pruning our business was only part of the gross margin
story. Our data capture/point-of-sale (DC/POS), network-
ing, enterprise solutions and North American logistics
businesses — all strong gross margin contributors —
grew significantly above the
company’s average sales growth.
Following the mid-year spike in fuel
prices, we introduced incremental
freight charges to offset transporta-
tion costs. Our industry was one of
the few to continue to bear the
burden of freight costs, and we
felt it was time to change that
practice for the long-term benefit of IT distribution.
Many of our peers soon followed suit, validating our
leadership stance.
12
YEARS PUBLIC
108
DISTRIBUTION CENTERS
14,500
EMPLOYEES