Hormel Foods 2011 Annual Report Download - page 15
Download and view the complete annual report
Please find page 15 of the 2011 Hormel Foods annual report below. You can navigate through the pages in the report by either clicking on the pages listed below, or by using the keyword search tool below to find specific information within the annual report.-
 1
1 -
2
-
3
-
4
-
 5
5 -
 6
6 -
 7
7 -
 8
8 -
 9
9 -
 10
10 -
 11
11 -
 12
12 -
 13
13 -
 14
14 -
 15
15 -
 16
16 -
 17
17 -
 18
18 -
 19
19 -
 20
20 -
 21
21 -
 22
22 -
 23
23 -
 24
24 -
 25
25 -
26
-
27
-
28
-
29
-
30
-
31
-
32
-
33
-
34
-
35
-
36
-
37
-
38
-
39
-
40
-
41
-
42
-
43
-
44
-
45
-
46
-
47
-
48
-
49
-
50
-
51
-
52
-
53
-
54
-
55
-
56
-
57
-
58
-
59
-
60
-
61
-
62
-
63
-
64
-
65
-
66
 |
 |
13
Hormel Foods Corporation
Ex
ecu
tiv
e
O
v
e
rvi
ew
F
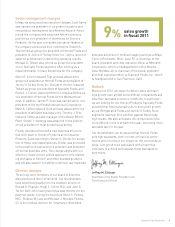
iscal 2011: Hormel Foods ach
i
eved record sales and earn
-
in
g
s durin
g
fiscal 2011. Sales
g
rew more than nine percent
compared to fiscal 2010, resultin
g
in total sales of $7.9 billion.
All
fi
ve reportin
g
se
g
ments contributed to the year-over-year
improvement. Earnin
g
s for the year were $474.2 million, an
increase of 1
9
.
9
percent. These results are even more impres
-
s
ive considering the comparisons are based on a 5
2
week
fiscal year in 2011 com
p
ared to a 5
3
week fiscal year in 2010.
E
conomic conditions during the year required significant pric
-
i
ng act
i
ons to keep pace w
i
th r
i
s
i
ng commod
i
ty costs. Desp
i
te
these
p
ressures, sales o
f
our value-added
p
roducts continued
to
p
er
f
orm well. Value-added
p
roducts under key
H
orme
l
®
an
d
Jennie-O Turkey Store
®
brands also bene
fi
tted
f
rom an
i
ncreased
i
nvestment
i
n advert
i
s
i
n
g
campa
ig
ns dur
i
n
g
the year.
O
ur Jennie-
O
Turkey
S
tore se
g
ment delivered outstandin
g
r
esults as improved sales of value-added products and hi
g
her
c
ommodity prices, alon
g
with continued efficiencies in oper
a
-
t
ions and its supply chain, drove the earnings growth.
G
rocery
P
roducts performance was mixed for the year. Earnings for
t
his segment declined compared to adjusted earnings
(
1
)
i
n the
prior year, as sales
g
rowth was unable to counter si
g
ni
fi
cant
i
nput cost pressures.
O
ur Refri
g
erated Foods se
g
ment had
a solid year, as stron
g
pork operatin
g
mar
g
ins and improved
v
alue-added sales more than offset hi
g
her raw material costs.
S
pecialty Foods saw operatin
g
profit decline as pricin
g
actions
and improved sales were unable to cover higher raw material
costs. Our All Other
(
International
)
segment turned in a great
y
ear, as strong pork exports led to double-digit growth for
sales and earn
i
ngs
.
Our strong financial performance continued to generate
substantial cash
fl
ows. We increased our investment in the
Me
g
aMex Foods joint venture with the addition o
f
the
Wh
o
lly
G
uacamol
e
®
line o
f
re
f
ri
g
erated dips and related products.
We also announced our 46th consecutive year o
f
dividend
i
ncreases, raisin
g
our dividend rate by 17.6 percent
f
or
fi
scal
20
1
2
, and repurchased 5.5 million shares of common stock,
spendin
g
$152.9 million.
F
i
sc
al
20
1
2
Ou
tl
oo
k: We antici
p
ate volatile commodity ma
r
-
kets including higher grain costs and lower pork operating
margins in fiscal 2012. Despite these challenges, we expect to
del
i
ver year-over-year
i
m
p
rovements
i
n both sales and ear
n
-
i
ngs, utilizing our balanced port
f
olio to help weather economic
u
ncertainty. A continuing priority will be our
f
ocus on building
branded, value-added
p
roduct l
i
nes wh
i
ch allow us to
p
rov
i
de
c
onsumers with
g
reat tastin
g
, convenient, and healthy
f
ood
options at a
g
ood value.
O
ur stron
g
balance sheet and free
c
ash
fl
ow will
g
ive us the opportunity to build our business
throu
g
h internal expansion or strate
g
ic acquisitions.
(
1
)
G
rocery Products adjusted earnin
g
s for fiscal
20
1
0
exclude a pretax char
g
e
o
f $9.7 million related to the closin
g
of the Company’s Valley Fresh plant in
T
urlock
,
California
.
C
ritical Accountin
g
Policies
T
his discussion and analysis o
f
fi
nancial condition and
results o
f
operations is based upon the consolidated
fi
nancial
s
tatements of Hormel Foods Corporation (the Company),
w
hich have been prepared in accordance with U.
S
.
g
enerally
accepted accountin
g
principles (GAAP). The preparation of
these financial statements requires the
C
ompany to make
estimates and judgments that affect the reported amounts of
assets, liabilities, revenues and ex
p
enses, and related disclo
-
s
ure of contingent assets and liabilities. The Company eval
u
-
ates, on an ongoing basis, its estimates for reasonableness
as changes occur in its business environment. The Company
bases its estimates on ex
p
erience, the use o
f
inde
p
endent
th
i
rd-
p
arty s
p
ec
i
al
i
sts, and var
i
ous other assum
p
t
i
ons that
are bel
i
eved to be reasonable under the c
i
rcumstances
,
the
results o
f
which
f
orm the basis
f
or makin
g
jud
g
ments about
the carryin
g
values o
f
assets and liabilities that are not read
-
ily apparent from other sources. Actual results may differ
materially from these estimates under different assumptions
o
r
co
n
d
iti
o
n
s
.
Critical accounting policies are defined as those that are
reflective of significant judgments, estimates, and uncertain
-
ties, and
p
otentially result in materially di
ff
erent results
under different assum
p
tions and conditions. The Com
p
any
believes the
f
ollowin
g
are its critical accountin
g
policies
:
I
nventor
y
Valuat
i
on:
T
he
C
ompany values its pork inventories
at the lower of cost or USDA market prices (primal values).
Wh
e
n th
e
ca
r
casses
a
r
e
d
i
sasse
m
b
l
ed
a
n
d
tr
a
n
s
f
e
rr
ed
fr
o
m
primal processin
g
to various manufacturin
g
departments,
the primal values, as ad
j
usted by the
C
ompany for product
s
pecifications and further processing, become the basis for
calculating inventory values. Turkey raw materials are repr
e
-
s
ented by the deboned meat
q
uantities. The Com
p
any values
these raw materials using a concept referred to as the “meat
cost pool.” The meat cost pool
i
s determ
i
ned by comb
i
n
i
ng
the cost to
g
row turkeys w
i
th process
i
n
g
costs, less any net
s
ales revenue
f
rom by-products created
f
rom the processin
g
and not used in producin
g
C
ompany products. The
C
ompany
has developed a series o
f
ratios usin
g
historical data and cu
r
-
rent market conditions
(
which themselves involve estimates
and jud
g
ment determinations by the Company) to allocate
the meat cost
p
ool to each meat com
p
onent.
S
ubstantially all
inventoriable expenses, meat, packaging, and supplies are
v
a
l
ue
d
b
y t
h
e average cost met
h
o
d.
G
oodwill and Other Intan
g
ibles: The Com
p
any’s identifiable
intangible assets are amortized over their use
f
ul lives, unless
the use
f
ul li
f
e is determined to be inde
fi
nite. The use
f
ul li
f
e o
f
an identi
fi
able intan
g
ible asset is based on an analysis o
f
se
v
-
eral
f
actors includin
g
: contractual, re
g
ulatory, or le
g
al obli
g
a-
tions, demand, competition, and industry trends.
G
oodwill and
indefinite-lived intan
g
ible assets are not amortized, but are
tested at least annually for impairment
.
MANA
G
E
M
E
NT’S DISCUSSIO
N
AN
D
A
NALY
S
I
S
OF
F
I
NAN
C
I
AL CO
N
D
I
TIO
N
AN
D
RESULTS
O
FOP
E
R
A
TIO
N
S