Goldman Sachs 2000 Annual Report Download - page 7
Download and view the complete annual report
Please find page 7 of the 2000 Goldman Sachs annual report below. You can navigate through the pages in the report by either clicking on the pages listed below, or by using the keyword search tool below to find specific information within the annual report.-
 1
1 -
 2
2 -
 3
3 -
 4
4 -
 5
5 -
 6
6 -
 7
7 -
 8
8 -
 9
9 -
 10
10 -
 11
11 -
 12
12 -
 13
13 -
 14
14 -
 15
15 -
 16
16 -
 17
17 -
 18
18 -
19
-
20
-
21
-
22
-
23
-
24
-
25
-
26
-
27
-
28
-
29
-
30
-
31
-
32
-
33
-
34
-
35
-
36
-
37
-
38
-
39
-
40
-
41
-
42
-
43
-
44
-
45
-
46
-
47
-
48
-
49
-
50
-
51
-
52
-
53
-
54
-
55
-
56
-
57
-
58
-
59
-
60
-
61
-
62
-
63
-
64
-
65
-
66
-
67
-
68
-
69
-
70
-
71
-
72
-
73
-
74
-
75
-
76
-
77
-
78
-
79
-
80
-
81
-
82
-
83
-
84
-
85
-
86
-
87
-
88
 |
 |

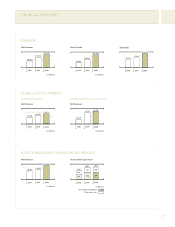
2000
$16,590
1999
$13,345
1998
$8,520
2000
$16,530
1999
$10,145
1998
$6,310
2000
22,627
1999
15,361
1998
13,033
2000
$5,371
1999
$4,359
1998
$3,368
1999
2000
$6,627
$5,773
1998
$2,379
2000
$4,592
1999
$3,213
1998
$2,773
$492
1999
$485
( in millions ) ( in millions )
( in millions ) ( in millions )
( in millions ) ( in billions )
Assets under management
Other client assets
Net Revenues Equity Capital
Net Revenues Net Revenues
Net Revenues Assets Under Supervision
Employees
227
258
$337
1998
142
195
2000
294
198
5
FINANCIAL HIGHLIGHTS
FIRMWIDE
ASSET MANAGEMENT AND SECURITIES SERVICES
Investment Banking Trading and Principal Investments
GLOBAL CAPITAL MARKETS