Freeport-McMoRan 2009 Annual Report Download - page 5
Download and view the complete annual report
Please find page 5 of the 2009 Freeport-McMoRan annual report below. You can navigate through the pages in the report by either clicking on the pages listed below, or by using the keyword search tool below to find specific information within the annual report.-
 1
1 -
 2
2 -
 3
3 -
 4
4 -
 5
5 -
 6
6 -
 7
7 -
 8
8 -
 9
9 -
 10
10 -
 11
11 -
 12
12 -
 13
13 -
 14
14 -
 15
15 -
 16
16 -
17
-
18
-
19
-
20
-
21
-
22
-
23
-
24
-
25
-
26
-
27
-
28
-
29
-
30
-
31
-
32
-
33
-
34
-
35
-
36
-
37
-
38
-
39
-
40
-
41
-
42
-
43
-
44
-
45
-
46
-
47
-
48
-
49
-
50
-
51
-
52
-
53
-
54
-
55
-
56
-
57
-
58
-
59
-
60
-
61
-
62
-
63
-
64
-
65
-
66
-
67
-
68
-
69
-
70
-
71
-
72
-
73
-
74
-
75
-
76
-
77
-
78
-
79
-
80
-
81
-
82
-
83
-
84
-
85
-
86
-
87
-
88
-
89
-
90
-
91
-
92
-
93
-
94
-
95
-
96
-
97
-
98
-
99
-
100
-
101
-
102
-
103
-
104
-
105
-
106
-
107
-
108
 |
 |

TO OUR SHAREHOLDERS
The year 2009 was one of extraordinary accomplishments for our Company.
In the face of the worst economic crisis since the 1930s, our global team
responded in an aggressive fashion to offset the impact of low copper and
molybdenum prices, to strengthen our nancial position and to preserve our
future growth options.
Weak market conditions, which began in late 2008, required us to make
difcult but necessary decisions to enable us to manage volatile conditions
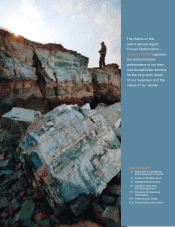
and position us for a bright future for our Company. The theme of this
year’s annual report, “Proven Performance — Shining Future,” captures the
demonstrated performance of our team and the optimism we have for the
long-term future of our business and the values of our assets.
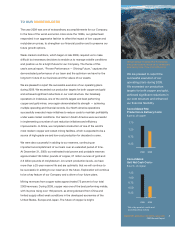
We are pleased to report the successful execution of our operating plans
during 2009. We exceeded our production targets for both copper and gold
and achieved signicant reductions in our cost structure. Our Grasberg
operations in Indonesia, one of the world’s largest and best performing
copper and gold mines, once again demonstrated its strength — achieving
multiple operating and nancial records. Our North America operations
successfully executed major initiatives to reduce costs to maintain protability
under weak market conditions. Our teams in South America were successful
in implementing a number of cost reduction initiatives and efciency
improvements. In Africa, we completed construction of one of the world’s
most modern copper and cobalt mining facilities, which is expected to be a
source of high-grade ore and low-cost production for decades to come.
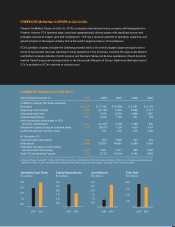
We were also successful in adding to our reserves, continuing an
important accomplishment of our team over an extended period of time.
At December 31, 2009, our estimated total proven and probable reserves
approximated 104 billion pounds of copper, 37 million ounces of gold and
2.6 billion pounds of molybdenum. At current production levels, we have
more than a 25-year reserve life and are optimistic that we will continue to
be successful in adding to our reserves in the future. Exploration will continue
to be a key feature of our Company and a driver of our future plans.
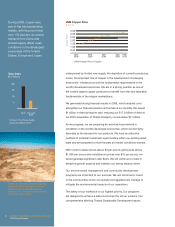
Mining revenues from copper sales approximated 75 percent of our total
2009 revenues. During 2009, copper was one of the best performing metals,
with its price rising over 150 percent, as strong demand from China and
limited supply offset weak conditions in the developed economies of the
United States, Europe and Japan. The future of copper is bright,
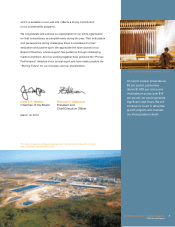
We are pleased to report the
successful execution of our
operating plans during 2009.
We exceeded our production
targets for both copper and gold,
achieved signicant reductions in
our cost structure and enhanced
our nancial exibility.
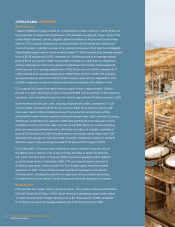
We have always recognized that the Grasberg
mine (pictured above) would be our cornerstone
asset during times of low commodity prices.
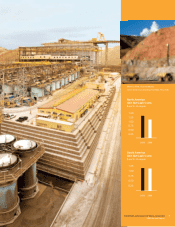
+ Net of by-product credits and
excluding Africa mining
3
FREEPORT-McMoRan COPPER & GOLD INC.
2009 Annual Report
20092008
Consolidated Site
Production & Delivery Costs
$ per lb. of copper
0.75
1.75
1.25
0.25
20092008
Consolidated
Unit Net Cash Costs+
$ per lb. of copper
0.50
0.75
1.25
1.00
0.25