Entergy 2006 Annual Report Download - page 41
Download and view the complete annual report
Please find page 41 of the 2006 Entergy annual report below. You can navigate through the pages in the report by either clicking on the pages listed below, or by using the keyword search tool below to find specific information within the annual report.-
 1
1 -
2
-
3
-
4
-
5
-
6
-
7
-
8
-
9
-
10
-
11
-
12
-
13
-
14
-
15
-
16
-
17
-
18
-
19
-
20
-
21
-
22
-
23
-
24
-
25
-
26
-
27
-
28
-
29
-
30
-
 31
31 -
 32
32 -
 33
33 -
 34
34 -
 35
35 -
 36
36 -
 37
37 -
 38
38 -
 39
39 -
 40
40 -
 41
41 -
 42
42 -
 43
43 -
 44
44 -
 45
45 -
 46
46 -
 47
47 -
 48
48 -
 49
49 -
 50
50 -
 51
51 -
52
-
53
-
54
-
55
-
56
-
57
-
58
-
59
-
60
-
61
-
62
-
63
-
64
-
65
-
66
-
67
-
68
-
69
-
70
-
71
-
72
-
73
-
74
-
75
-
76
-
77
-
78
-
79
-
80
-
81
-
82
-
83
-
84
-
85
-
86
-
87
-
88
-
89
-
90
-
91
-
92
-
93
-
94
-
95
-
96
-
97
-
98
-
99
-
100
-
101
-
102
-
103
-
104
-
105
-
106
-
107
-
108
-
109
-
110
-
111
-
112
-
113
-
114
 |
 |

ENTERGY CORPORATION AND SUBSIDIARIES 2
2000066
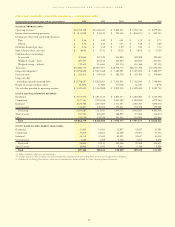
FIVE-YEAR SUMMARYof SELECTED FINANCIAL and OPERATING DATA
25
In thousands, except percentages and per share amounts 2006 2005 2004 2003 2002
SELECTED FINANCIAL DATA:
Operating revenues $10,932,158 $10,106,247 $ 9,685,521 $ 9,032,714 $ 8,299,052
Income from continuing operations $ 1,133,098 $ 943,125 $ 909,565 $ 804,273(a) $ 609,915
Earnings per share from continuing operations
Basic $ 5.46 $ 4.49 $ 4.01 $ 3.55 $ 2.73
Diluted $ 5.36 $ 4.40 $ 3.93 $ 3.48 $ 2.68
Dividends declared per share $ 2.16 $ 2.16 $ 1.89 $ 1.60 $ 1.34
Book value per share, year-end $ 40.45 $ 37.31 $ 38.25 $ 38.02 $ 35.24
Common shares outstanding:
At year-end 202,668 207,529 216,829 228,898 222,422
Weighted average – basic 207,457 210,142 226,864 226,804 223,047
Weighted average – diluted 211,452 214,441 231,194 231,146 227,303
Total assets $31,082,731 $30,857,657 $ 28,310,777 $28,527,388 $ 27,504,366
Long-term obligations(b) $ 8,996,620 $ 9,013,448 $ 7,180,291 $ 7,497,690 $ 7,488,919
Preferred stock $ 355,413 $ 459,924 $ 382,756 $ 355,189 $ 358,664
Long-term debt
(excluding currently maturing debt) $ 8,798,087 $ 8,824,493 $ 7,016,831 $ 7,322,940 $ 7,308,649
Return on average common equity 14.21% 11.20% 10.70% 11.21% 7.85%
Net cash flow provided by operating activities $ 3,419,415 $ 1,467,808 $ 2,929,319 $ 2,005,820 $ 2,181,703
UTILITY ELECTRIC OPERATING REVENUES:
Residential $ 3,193,351 $ 2,911,119 $ 2,841,517 $ 2,682,802 $ 2,439,590
Commercial 2,317,943 2,041,038 2,045,382 1,882,060 1,672,964
Industrial 2,630,386 2,419,465 2,311,185 2,081,781 1,850,476
Governmental 154,407 140,395 199,631 194,998 179,508
Total retail 8,296,087 7,512,017 7,397,715 6,841,641 6,142,538
Sales for resale(c) 611,943 656,287 388,899 371,646 330,010
Other 154,740 278,526 145,963 183,888 173,866
Total $ 9,062,770 $ 8,446,830 $ 7,932,577 $ 7,397,175 $ 6,646,414
UTILITY BILLED ELECTRIC ENERGY SALES (GWH):
Residential 31,665 31,569 32,897 32,817 32,581
Commercial 25,079 24,401 26,468 25,863 25,354
Industrial 38,339 37,615 40,293 38,637 41,018
Governmental 1,580 1,568 2,568 2,651 2,678
Total retail 96,663 95,153 102,226 99,968 101,631
Sales for resale(c) 10,803 11,459 8,623 9,248 9,828
Total 107,466 106,612 110,849 109,216 111,459
(a) Before cumulative effect of accounting changes.
(b) Includes long-term debt (excluding currently maturing debt), preferred stock with sinking fund, and non-current capital lease obligations.
(c) Includes sales to Entergy New Orleans, which was deconsolidated in 2006 and 2005. See Note 18 to the financial statements.