Eli Lilly 2009 Annual Report Download - page 3
Download and view the complete annual report
Please find page 3 of the 2009 Eli Lilly annual report below. You can navigate through the pages in the report by either clicking on the pages listed below, or by using the keyword search tool below to find specific information within the annual report.-
 1
1 -
 2
2 -
 3
3 -
 4
4 -
 5
5 -
 6
6 -
 7
7 -
 8
8 -
 9
9 -
 10
10 -
 11
11 -
 12
12 -
 13
13 -
 14
14 -
15
-
16
-
17
-
18
-
19
-
20
-
21
-
22
-
23
-
24
-
25
-
26
-
27
-
28
-
29
-
30
-
31
-
32
-
33
-
34
-
35
-
36
-
37
-
38
-
39
-
40
-
41
-
42
-
43
-
44
-
45
-
46
-
47
-
48
-
49
-
50
-
51
-
52
-
53
-
54
-
55
-
56
-
57
-
58
-
59
-
60
-
61
-
62
-
63
-
64
-
65
-
66
-
67
-
68
-
69
-
70
-
71
-
72
-
73
-
74
-
75
-
76
-
77
-
78
-
79
-
80
-
81
-
82
-
83
-
84
-
85
-
86
-
87
-
88
-
89
-
90
-
91
-
92
-
93
-
94
-
95
-
96
-
97
-
98
-
99
-
100
-
101
-
102
-
103
-
104
-
105
-
106
-
107
-
108
-
109
-
110
-
111
-
112
-
113
-
114
-
115
-
116
-
117
-
118
-
119
-
120
-
121
-
122
-
123
-
124
-
125
-
126
-
127
-
128
-
129
-
130
-
131
-
132
-
133
-
134
-
135
-
136
-
137
-
138
-
139
-
140
-
141
-
142
-
143
-
144
-
145
-
146
-
147
-
148
-
149
-
150
-
151
-
152
-
153
-
154
-
155
-
156
-
157
-
158
-
159
-
160
-
161
-
162
-
163
-
164
-
165
-
166
-
167
-
168
-
169
-
170
-
171
-
172
 |
 |

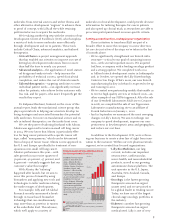
Revenue Per Employee Continues to Increase
($ thousands, percent growth)
In 2009, we continued
our focus on productivity.
Revenue per employee
increased 7 percent to
$540,000.
05 06 07 08 09
$504 +10%
$459 +21%
$344 +11%
$378 +10%
$540 +7%
Revenue Grows Across Therapeutic Areas
($ millions, percent growth)
Revenue in
Neuroscience, led
by Zyprexa and
Cymbalta, increased
7 percent as
compared to 2008
and represents
41 percent of our
2009 total revenue.
Endocrinology, led
by Humalog, Evista,
and Humulin,
increased 3 percent
and represents
26 percent of our
2009 total revenue.
Oncology was our
fastest-growing
therapeutic area with
growth of 10 percent
and represents
14 percent of our
2009 total revenue.
Neuroscience
Endocrinology
Oncology
Cardiovascular
Other Pharmaceutical
Animal Health
Collaboration and Other
$5,677.4
+3%
$1,207.2
+10%
$177.7
-14%
$664.5
+49%
$1,971.1
+5%
$8,976.4
+7%
$3,161.7
+10%
2009 Financial Highlights
ELI LILLY AND COMPANY AND SUBSIDIARIES
(Dollars in millions, except per-share data) Year Ended December 31 2009 2008 Change %
Revenue. . . . . . . . . . . . . . . . . . . . . . . . . . . . . . . . . . . . . . . . . . . . . . . . . . . $21,836.0 $20,371.9 7
Revenue—Pro forma as if ImClone acquisition was completed
on January 1, 2008 . . . . . . . . . . . . . . . . . . . . . . . . . . . . . . . . . . . . . . . 21,836.0 20,732.2 5
Research and development . . . . . . . . . . . . . . . . . . . . . . . . . . . . . . . . . . 4,326.5 3,840.9 13
Research and development as a percent of revenue. . . . . . . . . . . . . . 19.8% 18.8%
Net income (loss) . . . . . . . . . . . . . . . . . . . . . . . . . . . . . . . . . . . . . . . . . . . $ 4,328.8 $ (2,071.9)
Earnings (loss) per share—diluted . . . . . . . . . . . . . . . . . . . . . . . . . . . . 3.94 (1.89)
Reconciling items1: . . . . . . . . . . . . . . . . . . . . . . . . . . . . . . . . . . . . . . . . .
Net impact associated with ImClone acquisition2 . . . . . . . . . . . . . . — 4.46
Acquired in-process research and development (IPR&D) . . . . . . .05 .10
Asset impairments, restructuring, and other special charges . . . .42 1.54
Benefi t from resolution of IRS audit . . . . . . . . . . . . . . . . . . . . . . . . . — (.19)
Pro forma adjustment as if the ImClone acquisition was
completed on January 1, 2008. . . . . . . . . . . . . . . . . . . . . . . . . . . . . . — (.20)
Pro forma non-GAAP earnings per share—diluted. . . . . . . . . . . . . . . 4.423 3.82 16
Dividends paid per share. . . . . . . . . . . . . . . . . . . . . . . . . . . . . . . . . . . . . 1.96 1.88 4
Capital expenditures . . . . . . . . . . . . . . . . . . . . . . . . . . . . . . . . . . . . . . . . 765.0 947.2 (19)
Employees . . . . . . . . . . . . . . . . . . . . . . . . . . . . . . . . . . . . . . . . . . . . . . . . 40,360 40,450 —
1 For more information on these reconciling items, see the Financial Results section of the Executive Overview
on page 18 of the Form 10-K.
2 Includes $4.28 for acquired IPR&D related to this acquisition.
3 Numbers in the 2009 column do not add due to rounding.
8.2%
18.5%
11.1%
24.8%
12.1%
24.3%
-7.5%
-16.3%
Return on Assets and Shareholders’ Equity
05 06 07 08 09
15.8%
51.0%
ROA and ROE
increased from 2008
primarily due to
strong net income
growth in 2009 that
was partially related
to one-time charges in
2008 related to the
acquisition of ImClone
($4.73 billion) and
settlement of federal
and state investiga-
tions related to
Zyprexa ($1.48 billion),
which resulted in
negative ROA and
ROE in 2008.
Return on Assets (ROA)
Return on Shareholders’ Equity (ROE)