Electronic Arts 2012 Annual Report Download - page 134
Download and view the complete annual report
Please find page 134 of the 2012 Electronic Arts annual report below. You can navigate through the pages in the report by either clicking on the pages listed below, or by using the keyword search tool below to find specific information within the annual report.-
 1
1 -
2
-
3
-
4
-
5
-
6
-
7
-
8
-
9
-
10
-
11
-
12
-
13
-
14
-
15
-
16
-
17
-
18
-
19
-
20
-
21
-
22
-
23
-
24
-
25
-
26
-
27
-
28
-
29
-
30
-
31
-
32
-
33
-
34
-
35
-
36
-
37
-
38
-
39
-
40
-
41
-
42
-
43
-
44
-
45
-
46
-
47
-
48
-
49
-
50
-
51
-
52
-
53
-
54
-
55
-
56
-
57
-
58
-
59
-
60
-
61
-
62
-
63
-
64
-
65
-
66
-
67
-
68
-
69
-
70
-
71
-
72
-
73
-
74
-
75
-
76
-
77
-
78
-
79
-
80
-
81
-
82
-
83
-
84
-
85
-
86
-
87
-
88
-
89
-
90
-
91
-
92
-
93
-
94
-
95
-
96
-
97
-
98
-
99
-
100
-
101
-
102
-
103
-
104
-
105
-
106
-
107
-
108
-
109
-
110
-
111
-
112
-
113
-
114
-
115
-
116
-
117
-
118
-
119
-
120
-
121
-
122
-
123
-
 124
124 -
 125
125 -
 126
126 -
 127
127 -
 128
128 -
 129
129 -
 130
130 -
 131
131 -
 132
132 -
 133
133 -
 134
134 -
 135
135 -
 136
136 -
 137
137 -
 138
138 -
 139
139 -
 140
140 -
 141
141 -
 142
142 -
 143
143 -
 144
144 -
145
-
146
-
147
-
148
-
149
-
150
-
151
-
152
-
153
-
154
-
155
-
156
-
157
-
158
-
159
-
160
-
161
-
162
-
163
-
164
-
165
-
166
-
167
-
168
-
169
-
170
-
171
-
172
-
173
-
174
-
175
-
176
-
177
-
178
-
179
-
180
-
181
-
182
-
183
-
184
-
185
-
186
-
187
-
188
-
189
-
190
-
191
-
192
-
193
-
194
-
195
-
196
-
197
-
198
-
199
-
200
-
201
-
202
-
203
-
204
-
205
-
206
-
207
-
208
 |
 |

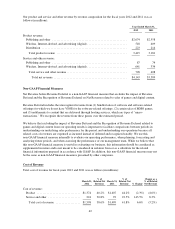
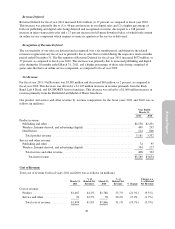
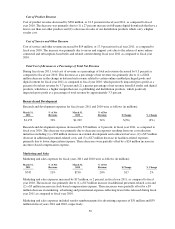
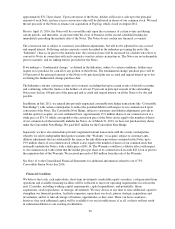
Cost of Product Revenue
Cost of product revenue decreased by $381 million, or 21.3 percent in fiscal year 2011, as compared to fiscal
year 2010. The decrease was primarily due to (1) a 27 percent increase in full-game digital downloads that have a
lower cost than our other products and (2) a decrease in sales of our distribution products which carry a higher
royalty cost.
Cost of Service and Other Revenue
Cost of service and other revenue increased by $14 million, or 17.9 percent in fiscal year 2011, as compared to
fiscal year 2010. The increase was primarily due to server and support costs due to the release of more online-
connected and subscription-based titles and related content during fiscal year 2011 as compared to fiscal year
2010.
Total Cost of Revenue as a Percentage of Total Net Revenue
During fiscal year 2011, total cost of revenue as a percentage of total net revenue decreased by 9.3 percent as
compared to fiscal year 2010. This decrease as a percentage of net revenue was primarily due to (1) a $266
million decrease in the change in deferred net revenue related to certain online-enabled packaged goods and
digital content for fiscal year 2011 as compared to fiscal year 2010, which positively impacted gross profit as a
percent of total net revenue by 3.7 percent and (2) a greater percentage of net revenue from EA studio and digital
products, which have a higher margin than our co-publishing and distribution products, which positively
impacted gross profit as a percentage of total revenue by approximately 3.3 percent.
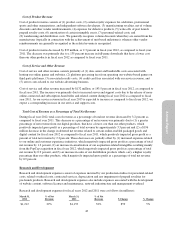
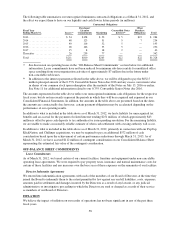
Research and Development
Research and development expenses for fiscal years 2011 and 2010 were as follows (in millions):
March 31,
2011
% of Net
Revenue
March 31,
2010
% of Net
Revenue $ Change % Change
$1,153 32% $1,229 34% $(76) (6%)
Research and development expenses decreased by $76 million, or 6 percent, in fiscal year 2011, as compared to
fiscal year 2010. This decrease was primarily due to decreases in expenses resulting from our cost reduction
initiatives including (1) a $38 million decrease in external development and contracted services, (2) a $37 million
decrease in additional personnel-related costs, and (3) a $27 million decrease in facilities-related expenses
primarily due to lower depreciation expense. These decreases were partially offset by a $24 million increase in
incentive-based compensation expense.
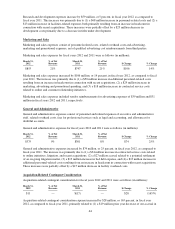
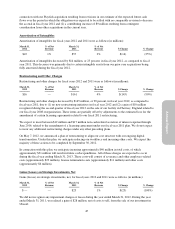
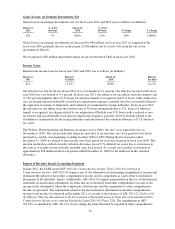
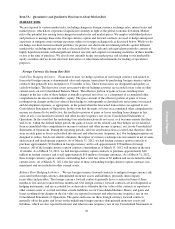
Marketing and Sales
Marketing and sales expenses for fiscal years 2011 and 2010 were as follows (in millions):
March 31,
2011
% of Net
Revenue
March 31,
2010
% of Net
Revenue $ Change % Change
$747 21% $730 20% $17 2%
Marketing and sales expenses increased by $17 million, or 2 percent, in fiscal year 2011, as compared to fiscal
year 2010. The increase was primarily due to (1) a $13 million increase in additional personnel-related costs and
(2) a $5 million increase in stock-based compensation expense. These increases were partially offset by a $5
million decrease in marketing, advertising and promotional expenses reflecting fewer titles released during fiscal
year 2011 as compared to fiscal year 2010.
Marketing and sales expenses included vendor reimbursements for advertising expenses of $31 million and $39
million in fiscal years 2011 and 2010, respectively.
50