Electronic Arts 2006 Annual Report Download - page 112
Download and view the complete annual report
Please find page 112 of the 2006 Electronic Arts annual report below. You can navigate through the pages in the report by either clicking on the pages listed below, or by using the keyword search tool below to find specific information within the annual report.-
 1
1 -
2
-
3
-
4
-
5
-
6
-
7
-
8
-
9
-
10
-
11
-
12
-
13
-
14
-
15
-
16
-
17
-
18
-
19
-
20
-
21
-
22
-
23
-
24
-
25
-
26
-
27
-
28
-
29
-
30
-
31
-
32
-
33
-
34
-
35
-
36
-
37
-
38
-
39
-
40
-
41
-
42
-
43
-
44
-
45
-
46
-
47
-
48
-
49
-
50
-
51
-
52
-
53
-
54
-
55
-
56
-
57
-
58
-
59
-
60
-
61
-
62
-
63
-
64
-
65
-
66
-
67
-
68
-
69
-
70
-
71
-
72
-
73
-
74
-
75
-
76
-
77
-
78
-
79
-
80
-
81
-
82
-
83
-
84
-
85
-
86
-
87
-
88
-
89
-
90
-
91
-
92
-
93
-
94
-
95
-
96
-
97
-
98
-
99
-
100
-
101
-
 102
102 -
 103
103 -
 104
104 -
 105
105 -
 106
106 -
 107
107 -
 108
108 -
 109
109 -
 110
110 -
 111
111 -
 112
112 -
 113
113 -
 114
114 -
 115
115 -
 116
116 -
 117
117 -
 118
118 -
 119
119 -
 120
120 -
 121
121 -
 122
122 -
123
-
124
-
125
-
126
-
127
-
128
-
129
-
130
-
131
-
132
-
133
-
134
-
135
-
136
-
137
-
138
-
139
-
140
-
141
-
142
-
143
-
144
-
145
-
146
-
147
-
148
-
149
-
150
-
151
-
152
-
153
-
154
-
155
-
156
-
157
-
158
-
159
-
160
-
161
-
162
-
163
-
164
-
165
-
166
-
167
-
168
-
169
-
170
-
171
-
172
-
173
-
174
-
175
-
176
-
177
-
178
-
179
-
180
-
181
-
182
-
183
-
184
-
185
-
186
-
187
-
188
-
189
-
190
-
191
-
192
-
193
-
194
-
195
-
196
 |
 |

companies to manufacture and sell our products in conjunction with other products, and selling
advertisements on our online web pages.
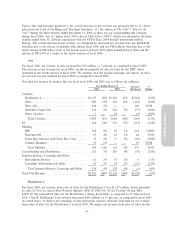
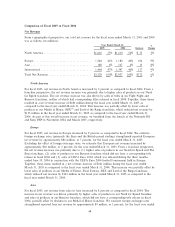
From a geographical perspective, our total net revenue for the Ñscal years ended March 31, 2006 and 2005
was as follows (in millions):
Year Ended March 31, Increase/ %
2006 2005 (Decrease) Change
North America ÏÏÏÏÏÏÏÏÏÏÏÏÏÏÏÏÏÏÏÏÏÏÏÏÏÏÏÏÏÏÏ $1,584 54% $1,665 53% $ (81) (5%)
Europe ÏÏÏÏÏÏÏÏÏÏÏÏÏÏÏÏÏÏÏÏÏÏÏÏÏÏÏÏÏÏÏÏÏÏÏÏÏÏ 1,174 40% 1,284 41% (110) (9%)
Asia ÏÏÏÏÏÏÏÏÏÏÏÏÏÏÏÏÏÏÏÏÏÏÏÏÏÏÏÏÏÏÏÏÏÏÏÏÏÏÏÏ 193 6% 180 6% 13 7%
International ÏÏÏÏÏÏÏÏÏÏÏÏÏÏÏÏÏÏÏÏÏÏÏÏÏÏÏÏÏÏÏÏÏ 1,367 46% 1,464 47% (97) (7%)
Total Net RevenueÏÏÏÏÏÏÏÏÏÏÏÏÏÏÏÏÏÏÏÏÏÏÏÏÏÏÏÏ $2,951 100% $3,129 100% $(178) (6%)
North America
For Ñscal 2006, net revenue in North America was $1,584 million, driven primarily by sales of
(1) Madden NFL 06, Need for Speed Most Wanted, NBA LIVE 06, NCAA»Football 06 and The Sims 2,
(2) titles for the PSP, which was launched in North America in March 2005, and (3) titles for the Xbox
360, which launched in November 2005. Overall, net revenue decreased $81 million, or 5 percent, as
compared to Ñscal 2005. As noted in the Overview section above, our industry is in the midst of a
transition from current-generation to next-generation consoles. Our net revenue was adversely impacted by
this transition in Ñscal 2006 as overall net revenue from sales of our titles for the PlayStation2, Xbox and
Nintendo GameCube decreased. While sales of titles for the PSP and the Xbox 360 helped to mitigate the
impact of the transition in Ñscal 2006, they were not enough to oÅset the overall decrease in net revenue
in North America. As the transition to next-generation consoles continues in Ñscal 2007, we expect net
revenue from sales of titles for current-generation consoles to further decline.
From a title and franchise perspective, the decrease in net revenue was primarily due to (1) lower sales
from our NFL Street, NBA Street, Def Jam and The Urbz
TM
franchises as there were no corresponding
titles released during Ñscal 2006, and (2) lower sales from our Lord of the Rings franchise which was
released on multiple platforms during Ñscal 2005 as compared to two platforms, the PSP and PC, during
Ñscal 2006. The overall decrease in net revenue was mitigated by (1) sales of BattleÑeld 2
TM
on the PC
which was released during the Ñrst quarter of Ñscal 2006 and BattleÑeld 2: Modern Combat
TM
on the
PlayStation 2 and Xbox released during the third quarter of Ñscal 2006, (2) increased net revenue from
our Madden franchise primarily resulting from the release of Madden NFL 06 on the Xbox 360 and PSP
in Ñscal 2006, and (3) increased net revenue from our Burnout franchise primarily resulting from the
release of Burnout
TM
Revenge on the Xbox 360 and Burnout
TM
Legends on the PSP in Ñscal 2006.
Europe
For Ñscal 2006, net revenue in Europe was $1,174 million, driven primarily by sales of Need for Speed
Most Wanted, FIFA 06, The Sims 2, Harry Potter and the Goblet of Fire, as well as sales of titles for the
PSP and Xbox 360 which were both introduced in Europe during Ñscal 2006. Overall, net revenue
declined $110 million, or 9 percent, as compared to Ñscal 2005. We estimate that foreign exchange rates
(primarily the Euro and the British pound sterling) decreased reported European net revenue by
approximately $36 million, or 3 percent, net of realized gains from hedging activities, for the Ñscal 2006 as
compared to Ñscal 2005. Excluding the eÅect of foreign exchange rates, we estimate that European net
revenue decreased by approximately $74 million, or 6 percent, for Ñscal 2006. Our net revenue in Europe
was adversely impacted by the transition to next-generation consoles in Ñscal 2006 as overall net revenue
from sales of our titles for the PlayStation 2, Xbox and Nintendo GameCube decreased. Sales of titles for
the PSP, Nintendo DS, and the Xbox 360, however, were enough to oÅset the overall decrease in net
revenue from sales of titles for current-generation consoles.
40