DuPont 2014 Annual Report Download - page 21
Download and view the complete annual report
Please find page 21 of the 2014 DuPont annual report below. You can navigate through the pages in the report by either clicking on the pages listed below, or by using the keyword search tool below to find specific information within the annual report.-
 1
1 -
2
-
3
-
4
-
5
-
6
-
7
-
8
-
9
-
10
-
 11
11 -
 12
12 -
 13
13 -
 14
14 -
 15
15 -
 16
16 -
 17
17 -
 18
18 -
 19
19 -
 20
20 -
 21
21 -
 22
22 -
 23
23 -
 24
24 -
 25
25 -
 26
26 -
 27
27 -
 28
28 -
 29
29 -
 30
30 -
 31
31 -
32
-
33
-
34
-
35
-
36
-
37
-
38
-
39
-
40
-
41
-
42
-
43
-
44
-
45
-
46
-
47
-
48
-
49
-
50
-
51
-
52
-
53
-
54
-
55
-
56
-
57
-
58
-
59
-
60
-
61
-
62
-
63
-
64
-
65
-
66
-
67
-
68
-
69
-
70
-
71
-
72
-
73
-
74
-
75
-
76
-
77
-
78
-
79
-
80
-
81
-
82
-
83
-
84
-
85
-
86
-
87
-
88
-
89
-
90
-
91
-
92
-
93
-
94
-
95
-
96
-
97
-
98
-
99
-
100
-
101
-
102
-
103
-
104
-
105
-
106
 |
 |

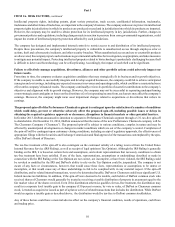
Part II
ITEM 7. MANAGEMENT'S DISCUSSION AND ANALYSIS OF FINANCIAL CONDITION AND RESULTS OF
OPERATIONS, continued
20
(Dollars in millions) 2014 2013 2012
NET SALES $ 34,723 $ 35,734 $ 34,812
2014 versus 2013 The table below shows a regional breakdown of 2014 consolidated net sales based on location of customers
and percentage variances from prior year:
Percent Change Due to:
(Dollars in billions) 2014
Net Sales
Percent
Change vs.
2013 Local
Price Currency
Effect Volume Portfolio / Other
Worldwide $ 34.7 (3) (1)(1) 1 (2)
U.S. & Canada 14.0 (5) (1) — (1)(3)
EMEA18.5 1 — — 2 (1)
Asia Pacific 7.7 (1) (2)(2) 4 (1)
Latin America 4.5 (6) (1)(3)(1)(1)
1. Europe, Middle East, and Africa (EMEA).
Net sales of $34.7 billion were 3 percent below prior year including a 2 percent reduction from portfolio changes, primarily due
to changes within the Performance Chemicals and Performance Materials segments and 1 percent negative currency impact. The
negative currency impact was driven by the strengthening of the U.S. dollar against most currencies. Local prices were 1 percent
lower principally due to lower prices in the Performance Chemicals and Electronics & Communications segments, the latter
reflecting lower metals prices. Agriculture local prices were up 1 percent. Sales in developing markets of $11.8 billion were
essentially flat versus prior year and represent 34 percent of total company sales versus 33 percent in 2013. Developing markets
include China, India and countries located in Latin America, Eastern and Central Europe, Middle East, Africa and Southeast Asia.
2013 versus 2012 The table below shows a regional breakdown of 2013 consolidated net sales based on location of customers
and percentage variances from 2012:
Percent Change Due to:
(Dollars in billions) 2013
Net Sales
Percent
Change vs.
2012 Local
Price Currency
Effect Volume Portfolio / Other
Worldwide $ 35.7 3 (1)(1) 5 —
U.S. & Canada 14.8 4 1 — 3 —
EMEA18.4 4 (2) 1 4 1
Asia Pacific 7.7 (3) (6)(3) 6 —
Latin America 4.8 6 — (3) 9 —
1. Europe, Middle East, and Africa (EMEA).
Net sales increased 3 percent, reflecting a 5 percent increase in worldwide sales volume with growth in all segments. Local prices
were 1 percent lower principally due to a 12 percent decline in Performance Chemicals prices and a pass through of lower precious
metals prices for Electronics & Communications. Negative currency impact reflects a weaker Brazilian real and Indian rupee,
partly offset by a stronger Euro. Sales in developing markets of $11.9 billion improved 7 percent on 10 percent higher volume,
and the percentage of total company sales in these markets increased to 33 percent from 32 percent in 2012.