Dollar Tree 2012 Annual Report Download - page 19
Download and view the complete annual report
Please find page 19 of the 2012 Dollar Tree annual report below. You can navigate through the pages in the report by either clicking on the pages listed below, or by using the keyword search tool below to find specific information within the annual report.-
 1
1 -
2
-
3
-
4
-
5
-
6
-
7
-
8
-
 9
9 -
 10
10 -
 11
11 -
 12
12 -
 13
13 -
 14
14 -
 15
15 -
 16
16 -
 17
17 -
 18
18 -
 19
19 -
 20
20 -
 21
21 -
 22
22 -
 23
23 -
 24
24 -
 25
25 -
 26
26 -
 27
27 -
 28
28 -
 29
29 -
30
-
31
-
32
-
33
-
34
-
35
-
36
-
37
-
38
-
39
-
40
-
41
-
42
-
43
-
44
-
45
-
46
-
47
-
48
-
49
-
50
-
51
-
52
 |
 |

Management’s Discussion & Analysis of
Financial Condition and Results of Operations
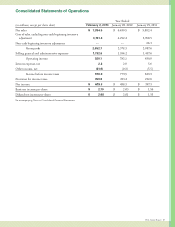
Selling, General and Administrative Expenses.
Selling, general and administrative expenses, as a
percentageofnetsales,decreasedto24.1%for2011
comparedto24.8%for2010.edecreaseisprimarily
due to the following:
•Payrollexpensesdecreased45basispointsdueto
leveraging associated with the increase in comparable
store net sales in the current year, lower store
hourly payroll and lower incentive compensation
achievement.
•Depreciationdecreased25basispointsprimarily
due to the leveraging associated with the increase in
comparable store net sales in the current year.
Operating Income. Operating income margin was
11.8%in2011comparedto10.7%in2010.Excluding
the$26.3millionnon-cashadjustmenttobeginning
inventory,operatingincomemarginwas11.1%in2010.
Due to the reasons noted above, operating income
marginexcludingthischarge,improved70basispoints.
Income Taxes.Oureectivetaxratewas37.4%in2011
and36.9%in2010.
Fiscal year ended January 28, 2012 compared to
fiscal year ended January 29, 2011
Net Sales.Netsalesincreased12.7%,or$748.0million,
in2011comparedto2010,resultingfromsalesinour
newstoresanda6.0%increaseincomparablestorenet
sales.Comparablestorenetsalesarepositivelyaected
by our expanded and relocated stores, which we include
in the calculation, and, to a lesser extent, are negatively
aectedwhenweopennewstoresorexpandstoresnear
existing ones.
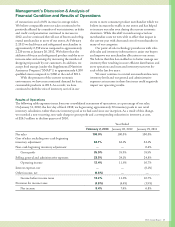
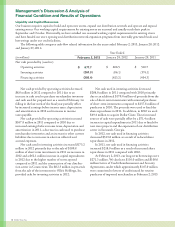
efollowingtablesummarizesthecomponents
ofthechangesinourstorecountforscalyearsended
January28,2012andJanuary29,2011.
January 28,
2012
January29,
2011
Newstores 278 235
Acquired stores —86
Expandedor
relocated stores 91 95
Closed stores (28) (26)
Ofthe2.4millionsellingsquarefootincreasein2011
approximately0.3millionwasaddedbyexpanding
existing stores.
Grossprotmarginwas35.9%in2011compared
to35.5%in2010.Excludingtheeectofthe$26.3
millionnon-cashbeginninginventoryadjustment,gross
protmarginremainedat35.9%.Improvementininitial
mark-up in many categories and occupancy and distribu-
tioncostleveragewereosetbyanincreaseinthemixof
higher cost consumer product merchandise and a smaller
reductionintheshrinkaccrualrateinscal2011thanin
scal2010.
2012AnnualReport17