Dollar Tree 2004 Annual Report Download - page 5
Download and view the complete annual report
Please find page 5 of the 2004 Dollar Tree annual report below. You can navigate through the pages in the report by either clicking on the pages listed below, or by using the keyword search tool below to find specific information within the annual report.-
 1
1 -
 2
2 -
 3
3 -
 4
4 -
 5
5 -
 6
6 -
 7
7 -
 8
8 -
 9
9 -
 10
10 -
 11
11 -
 12
12 -
 13
13 -
 14
14 -
 15
15 -
 16
16 -
17
-
18
-
19
-
20
-
21
-
22
-
23
-
24
-
25
-
26
-
27
-
28
-
29
-
30
-
31
-
32
-
33
-
34
-
35
-
36
-
37
-
38
-
39
-
40
-
41
-
42
-
43
-
44
-
45
-
46
-
47
-
48
-
49
-
50
-
51
-
52
-
53
-
54
 |
 |

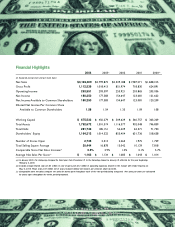
Financial Highlights
2004 2003(a) 2002 2001 2000(b)
(In thousands, except store and per share data )
Net Sales $3,126,009 $2,799,872 $2,329,188 $1,987,271 $1,688,105
Gross Profit 1,112,539 1,018,413 851,974 718,830 624,891
Operating Income 293,551 293,597 253,921 203,865 203,036
Net Income 180,250 177,583 154,647 123,081 121,622
Net Income Available to Common Shareholders 180,250 177,583 154,647 123,081 120,209
Diluted Net Income Per Common Share
Available to Common Shareholders 1.58 1.54 1.35 1.09 1.08
Working Capital $ 675,532 $ 450,279 $ 509,629 $ 360,757 $ 303,209
Total Assets 1,792,672 1,501,519 1,116,377 902,048 746,859
Total Debt 281,746 185,151 54,429 62,371 71,730
Shareholders’ Equity 1,164,212 1,014,522 855,404 651,736 518,658
Number of Stores Open 2,735 2,513 2,263 1,975 1,729
Total Selling Square Footage 20,444 16,878 13,042 10,129 7,818
Comparable Store Net Sales Increase(c) 0.5% 2.9% 1.0% 0.1% 5.7%
Average Net Sales Per Store(c) $ 1,163 $ 1,134 $ 1,083 $ 1,043 $ 1,014
(a) In January 2003, the Company changed its fiscal year from December 31 to the Saturday closest to January 31, effective for the year beginning
February 2, 20 03 .
(b) Includes merger-related costs of $1.1 million in cost of sales and $3.3 million in operating expenses related to the merger with Dollar Express on
M ay 5, 20 0 0. These cost s, $3.1 million net of taxes, reduced diluted net income per common share by $0.02 .
(c) Comparable store net sales compare net sales for stores open throughout each of the two periods being compared. N et sales per store are calculated
for stores open throughout the entire period presented.