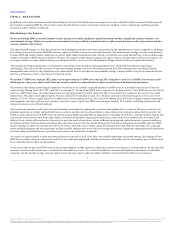
DSW 2014 Annual Report Download - page 21
Download and view the complete annual report
Please find page 21 of the 2014 DSW annual report below. You can navigate through the pages in the report by either clicking on the pages listed below, or by using the keyword search tool below to find specific information within the annual report.
Table of Contents
The following table sets forth, for the periods presented, various selected financial information. Such selected consolidated financial data should be read in
conjunction with our Consolidated Financial Statements, including the notes thereto, set forth in Item 8 of this Annual Report on Form 10-K and
“Management’s Discussion and Analysis of Financial Condition and Results of Operations” set forth in Item 7 of this Annual Report on Form 10-K.
Fiscal
2014
2013
2012
2011(1)
2010(1)
(dollars in thousands, except per share and net sales per average gross square foot)
Net sales(3) $ 2,496,092
$ 2,368,668
$ 2,257,778
$ 2,024,329
$ 1,822,376
Gross profit(4) $ 755,021
$ 739,287
$ 724,720
$ 653,947
$ 565,681
Operating expenses $ (512,889)
$ (497,899)
$ (481,797)
$ (448,583)
$ (396,107)
Depreciation $ 68,153
$ 64,100
$ 57,801
$ 51,237
$ 48,262
Operating profit $ 242,132
$ 241,388
$ 236,802
$ 151,450
$ 120,560
Income from continuing operations before
income taxes and income from Town Shoes $ 244,927
$ 244,007
$ 240,613
$ 142,269
$ 111,793
Income tax (provision) benefit $ (95,713)
$ (92,705)
$ (95,427)
$ 58,069
$ (59,973)
Income from continuing operations, net of
tax $ 153,027
$ 151,302
$ 145,186
$ 200,338
$ 51,820
Total income (loss) from discontinued
operations, net of tax $ 272
—
$ 1,253
$ (4,855)
$ 6,628
Less: Income attributable to noncontrolling
interests —
—
—
$ (20,695)
$ (40,654)
Net income, net of noncontrolling interests $ 153,299
$ 151,302
$ 146,439
$ 174,788
$ 17,794
Diluted earnings per share from continuing
operations, net of noncontrolling interests $ 1.69
$ 1.65
$ 1.60
$ 2.34
$ 0.26
Diluted earnings (loss) per share from
discontinued operations $ 0.00
$ —
$ 0.01
$ (0.07)
$ 0.15
Diluted earnings per share, net of
noncontrolling interests $ 1.69
$ 1.65
$ 1.62
$ 2.27
$ 0.41
Weighted average number of diluted shares
outstanding 90,612
91,901
90,606
74,276
43,152
Cash and investments (5) $ 447,128
$ 579,307
$ 409,890
$ 429,558
$ 390,670
Inventory $ 450,836
$ 397,768
$ 393,794
$ 334,390
$ 309,013
Total assets $ 1,438,243
$ 1,421,244
$ 1,262,103
$ 1,207,900
$ 1,041,477
Working capital(6) $ 484,680
$ 528,362
$ 546,479
$ 560,458
$ 320,629
Current ratio(7) 2.7
2.9
3.0
2.8
1.8
Total shareholders’ equity $ 1,011,120
$ 998,544
$ 858,579
$ 786,587
$ 488,869
Long-term obligations(8) —
—
—
—
$ 132,132
Cash dividends per share(9) $ 0.75
$ 0.375
$ 1.435
$ 1.15
—
Capital expenditures(10) $ 93,314
$ 83,800
$ 99,752
$ 76,912
$ 52,298
17
Source: DSW Inc., 10-K, March 26, 2015 Powered by Morningstar® Document Research℠
The information contained herein may not be copied, adapted or distributed and is not warranted to be accurate, complete or timely. The user assumes all risks for any damages or losses arising from any use of this information,
except to the extent such damages or losses cannot be limited or excluded by applicable law. Past financial performance is no guarantee of future results.


