DSW 2009 Annual Report Download - page 2
Download and view the complete annual report
Please find page 2 of the 2009 DSW annual report below. You can navigate through the pages in the report by either clicking on the pages listed below, or by using the keyword search tool below to find specific information within the annual report.-
 1
1 -
 2
2 -
 3
3 -
 4
4 -
 5
5 -
 6
6 -
 7
7 -
 8
8 -
 9
9 -
 10
10 -
 11
11 -
 12
12 -
 13
13 -
14
-
15
-
16
-
17
-
18
-
19
-
20
-
21
-
22
-
23
-
24
-
25
-
26
-
27
-
28
-
29
-
30
-
31
-
32
-
33
-
34
-
35
-
36
-
37
-
38
-
39
-
40
-
41
-
42
-
43
-
44
-
45
-
46
-
47
-
48
-
49
-
50
-
51
-
52
-
53
-
54
-
55
-
56
-
57
-
58
-
59
-
60
-
61
-
62
-
63
-
64
-
65
-
66
-
67
-
68
-
69
-
70
-
71
-
72
-
73
-
74
-
75
-
76
-
77
-
78
-
79
-
80
 |
 |
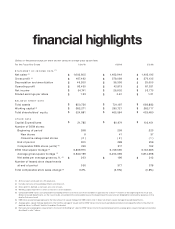
financial highlights
(Dollars in thousands except per share and net sales per average gross square foot)
For the Fiscal Year Ended 1/30/10 1/31/09 2/2/08
STATEMENT OF INCOME DATA (1)
Net sales (2) 1,602,605 1,462,944 1,405,615
Gross profit (3) 467,492 379,099 370,135
Depreciation and amortization 46,260 36,336 25,055
Operating profit 93,455 42,813 81,321
Net income 54,741 26,902 53,775
Diluted earnings per share 1.23 0.61 1.21
BALANCE SHEET DATA
Total assets 850,756 721,197 693,882
Working capital (4) 382,271 295,721 282,717
Total shareholders’ equity 524,881 465,584 433,480
OTHER DATA
Capital Expenditures 21,785 80,974 102,451
Number of DSW stores:
Beginning of period 298 259 223
New stores 9 41 37
Closed/re-categorized stores ( 2 ) ( 2 ) ( 1 )
End of period 305 298 259
Comparable DSW stores (units) (5) 249 217 192
DSW total square footage (6) 6,839,975 6,749,690 6,142,685
Average gross square footage (7) 6,840,199 6,454,396 5,814,398
Net sales per average gross sq. ft. (8) 203 196 212
Number of leased shoe departments
at end of period 356 377 378
Total comparable store sales change (5) 3.2% (5.9%) (0.8%)
(1) All fiscal years are based on a 52-week year.
(2) Includes net sales of leased departments and dsw.com.
(3) Gross profit is defined as net sales less cost of sales.
(4) Working capital represents current assets less current liabilities.
(5) Comparable DSW stores and comparable leased departments are those units that have been in operation for at least 14 months at the beginning of the fiscal year.
Stores or leased departments, as the case may be, are added to the comparable base at the beginning of the year and are dropped for comparative purposes in the
quarter they are closed.
(6) DSW total square footage represents the total amount of square footage for DSW stores only; it does not reflect square footage of leased departments.
(7) Average gross square footage represents the monthly average of square feet for DSW stores only for each period presented and consequently reflects the effect of
opening stores in different months throughout the period.
(8) Net sales per average gross square foot is the result of dividing net sales for DSW stores only for the period presented, by average gross square footage calculated as
described in note 7 above.
$
$
$
$
$
$
$
$
$
$
$
$
$
$
$
$
$
$
$
$
$
$
$
$
$
$
$
$
$
$
$
$
$