DELPHI 2013 Annual Report Download - page 11
Download and view the complete annual report
Please find page 11 of the 2013 DELPHI annual report below. You can navigate through the pages in the report by either clicking on the pages listed below, or by using the keyword search tool below to find specific information within the annual report.-
 1
1 -
 2
2 -
 3
3 -
 4
4 -
 5
5 -
 6
6 -
 7
7 -
 8
8 -
 9
9 -
 10
10 -
 11
11 -
 12
12 -
 13
13 -
 14
14 -
 15
15 -
 16
16 -
 17
17 -
 18
18 -
 19
19 -
 20
20 -
 21
21 -
 22
22 -
23
-
24
-
25
-
26
-
27
-
28
-
29
-
30
-
31
-
32
-
33
-
34
-
35
-
36
-
37
-
38
-
39
-
40
-
41
-
42
-
43
-
44
-
45
-
46
-
47
-
48
-
49
-
50
-
51
-
52
-
53
-
54
-
55
-
56
-
57
-
58
-
59
-
60
-
61
-
62
-
63
-
64
-
65
-
66
-
67
-
68
-
69
-
70
-
71
-
72
-
73
-
74
-
75
-
76
-
77
-
78
-
79
-
80
-
81
-
82
-
83
-
84
-
85
-
86
-
87
-
88
-
89
-
90
-
91
-
92
-
93
-
94
-
95
-
96
-
97
-
98
-
99
-
100
-
101
-
102
-
103
-
104
-
105
-
106
-
107
-
108
-
109
-
110
-
111
-
112
-
113
-
114
-
115
-
116
-
117
-
118
-
119
-
120
-
121
-
122
-
123
-
124
-
125
-
126
-
127
-
128
-
129
-
130
-
131
-
132
-
133
-
134
-
135
-
136
-
137
-
138
-
139
-
140
-
141
-
142
-
143
-
144
-
145
-
146
-
147
-
148
-
149
-
150
-
151
-
152
-
153
-
154
-
155
-
156
-
157
-
158
-
159
-
160
 |
 |

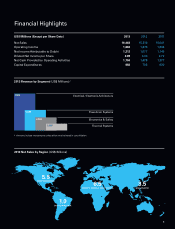
Financial Highlights
US$ Millions (Except per Share Data) 2013 2012 2011
Net Sales 16,463 15,519 16,041
Operating Income 1,684 1,476 1,644
Net Income Attributable to Delphi 1,212 1,077 1,145
Diluted Net Income per Share 3.89 3.33 2.72
Net Cash Provided by Operating Activities 1,750 1,478 1,377
Capital Expenditures 682 705 630
2013 Net Sales by Region (US$ Billions)
5.5
NORTH AMERICA
1.0
SOUTH AMERICA
6.5
EUROPE, MIDDLE EAST, AFRICA
3.5
ASIA PACIFIC
9
2013 Revenue by Segment (US$ Millions)
1
Electronics & Safety
7,972 Electrical / Electronic Architecture
4,424 Powertrain Systems
Thermal Systems
2,830
1,468
1 Amounts include intercompany sales which are eliminated in consolidation