Computer Associates 1997 Annual Report Download - page 3
Download and view the complete annual report
Please find page 3 of the 1997 Computer Associates annual report below. You can navigate through the pages in the report by either clicking on the pages listed below, or by using the keyword search tool below to find specific information within the annual report.-
 1
1 -
 2
2 -
 3
3 -
 4
4 -
 5
5 -
 6
6 -
 7
7 -
 8
8 -
 9
9 -
 10
10 -
 11
11 -
 12
12 -
 13
13 -
 14
14 -
15
-
16
-
17
-
18
-
19
-
20
-
21
-
22
-
23
-
24
-
25
-
26
-
27
-
28
-
29
-
30
-
31
-
32
-
33
-
34
-
35
-
36
 |
 |

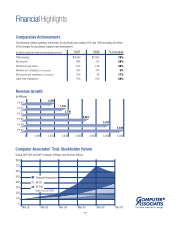
Financial Highlights
Comparative Achievements
The following reflects summary information for the fiscal years ended 1997 and 1996 excluding the effect
of the charges for purchased research and development.
(In millions, except per share and per employee amounts) 1997 1996 % Increase
Total revenue $4‚040 $3,505 15%
Net income 964 752 28%
Net income per share 2.54 1.99 28%
Revenue per employee (In thousands) 437 414 6%
Net income per employee (In thousands) 104 89 17%
Cash from Operations 790 619 28%
Computer Associates’ Total Stockholder Return
Versus S&P 500 and S&P Computer Software and Services Indices
800
700
600
500
400
300
200
100
0
Computer Associates
SP CS
SP 500
Index 100=3/31/92
Mar 92 Mar 93 Mar 94 Mar 95 Mar 96 Mar 97
1
0 1,000 1,500 2,000 2,500 3,000 3,500 4,000
Revenue Growth
(In Millions)
1,509
1,841
2,148
2,623
FY 92
FY 93
FY 94
FY 95
FY 96
FY 97
3,505
4,040