Comfort Inn 2005 Annual Report Download - page 14
Download and view the complete annual report
Please find page 14 of the 2005 Comfort Inn annual report below. You can navigate through the pages in the report by either clicking on the pages listed below, or by using the keyword search tool below to find specific information within the annual report.-
 1
1 -
2
-
3
-
 4
4 -
 5
5 -
 6
6 -
 7
7 -
 8
8 -
 9
9 -
 10
10 -
 11
11 -
 12
12 -
 13
13 -
 14
14 -
 15
15 -
 16
16 -
 17
17 -
 18
18 -
 19
19 -
 20
20 -
 21
21 -
 22
22 -
 23
23 -
 24
24 -
25
-
26
-
27
-
28
-
29
-
30
-
31
-
32
-
33
-
34
-
35
-
36
-
37
-
38
-
39
-
40
-
41
-
42
-
43
-
44
-
45
-
46
-
47
-
48
-
49
-
50
-
51
-
52
-
53
-
54
-
55
-
56
-
57
-
58
-
59
 |
 |
our business does not require significant reinvestment of capital, we utilize cash in ways that management
believes provide the greatest returns to our shareholders which include share repurchases and dividends. We
believe the Company’s cash flow from operations and available financing capacity are sufficient to meet the
expected future operating, investing and financing needs of the business.
Refer to MD&A heading “Liquidity and Capital Resources” for additional analysis.
The principal factors that affect the Company’s results are: the number and relative mix of franchised hotels;
growth in the number of hotels under franchise; occupancy and room rates achieved by the hotels under
franchise; the effective royalty rate achieved; and our ability to manage costs. The number of rooms at franchised
properties and occupancy and room rates at those properties significantly affect the Company’s results because
our fees are based upon room revenues at franchised hotels. The key industry standard for measuring hotel-
operating performance is revenue per available room (“RevPAR”), which is calculated by multiplying the
percentage of occupied rooms by the average daily room rate realized. Our variable overhead costs associated
with franchise system growth have historically been less than incremental royalty fees generated from new
franchises. Accordingly, continued growth of our franchise business should enable us to realize benefits from the
operating leverage in place and improve operating results.
Operations Review
Comparison of 2005 Operating Results and 2004 Operating Results
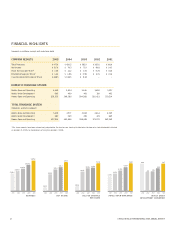
The Company recorded net income of $87.6 million for the year ended December 31, 2005, an increase of
$13.3 million, or 18% from $74.3 million for the year ended December 31, 2004. The increase in net income for
the year is primarily attributable to an $18.8 million improvement in operating income and a decline in the
effective income tax rate from 35.1% to 33.0% partially offset by a $2.5 million expense increase in other
income and expenses. The effective income tax rate declined primarily due to the resolution of tax contingencies
of approximately $4.9 million in 2005 compared to $1.2 million in 2004 offset by additional income tax expense
of $1.2 million in 2005 related to the Company’s repatriation of foreign earnings. The increase in net other
income and expenses was primarily related to a $3.7 million increase in interest expense offset by the loss on
extinguishment of debt of $0.7 million incurred during 2004. Operating income increased as a result of a $26.2
million, or 12.9% increase in franchising revenues (total revenues excluding marketing and reservation revenues
and hotel operations) and a decrease in depreciation and amortization expense partially offset by an $8.7 million
increase in selling, general and administrative expense.
12