ComEd 2011 Annual Report Download - page 28
Download and view the complete annual report
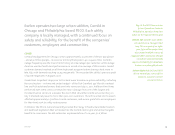
Please find page 28 of the 2011 ComEd annual report below. You can navigate through the pages in the report by either clicking on the pages listed below, or by using the keyword search tool below to find specific information within the annual report.-
 1
1 -
2
-
3
-
4
-
5
-
6
-
7
-
8
-
9
-
10
-
11
-
12
-
13
-
14
-
15
-
16
-
17
-
 18
18 -
 19
19 -
 20
20 -
 21
21 -
 22
22 -
 23
23 -
 24
24 -
 25
25 -
 26
26 -
 27
27 -
 28
28 -
 29
29 -
 30
30 -
 31
31 -
 32
32 -
 33
33 -
 34
34 -
 35
35 -
 36
36 -
 37
37 -
 38
38 -
39
-
40
-
41
-
42
-
43
-
44
-
45
-
46
 |
 |

26
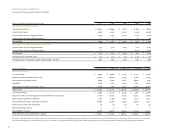
Summary Annual Report
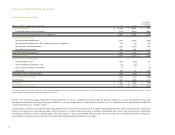
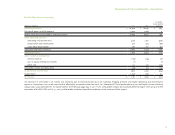
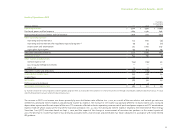
Summary of Earnings and Financial Condition
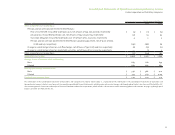
For the years ended Dec. 31,
(Dollars in millions, except for per share data) 2011 2010 2009 2008 2007
Statement of operations data
Operating revenues $ 18,924 $ 18,644 $ 17,318 $ 18,859 $ 18,916
Operating income 4,480 4,726 4,750 5,299 4,668
Income from continuing operations 2,495 2,563 2,707 2,717 2,726
Income from discontinued operations — — — 20 10
Net income $ 2,495 $ 2,563 $ 2,707 $ 2,737 $ 2,736
Earnings per average common share (diluted)
Income from continuing operations 3.75 3.87 4.09 4.10 4.03
Income from discontinued operations — — — 0.03 0.02
Net income $ 3.75 $ 3.87 $ 4.09 $ 4.13 $ 4.05
Dividends per common share $ 2.10 $ 2.10 $ 2.10 $ 2.03 $ 1.76
Average shares of common stock outstanding – diluted 665 663 662 662 676
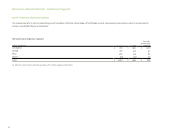
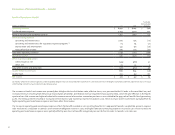
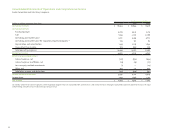
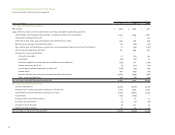
Dec. 31,
(Dollars in millions) 2011 2010 2009 2008 (a) 2007 (a)(b)
Balance sheet data
Current assets $ 5,489 $ 6,398 $ 5,441 $ 5,130 $ 4,416
Property, plant and equipment, net 32,570 29,941 27,341 25,813 24,153
Noncurrent regulatory assets 4,839 4,140 4,872 5,940 5,133
Goodwill 2,625 2,625 2,625 2,625 2,625
Other deferred debits and other assets 9,569 9,136 8,901 8,038 8,760
Total assets $ 55,092 $ 52,240 $ 49,180 $ 47,546 $ 45,087
Current liabilities $ 4,989 $ 4,240 $ 4,238 $ 3,811 $ 5,466
Long-term debt, including long-term debt to financing trusts 12,189 12,004 11,385 12,592 11,965
Noncurrent regulatory liabilities 3,771 3,555 3,492 2,520 3,301
Other deferred credits and other liabilities 19,668 18,791 17,338 17,489 14,131
Preferred securities of subsidiary 87 87 87 87 87
Noncontrolling interest 3 3 — — —
Shareholders’ equity 14,385 13,560 12,640 11,047 10,137
Total liabilities and shareholders’ equity $ 55,092 $ 52,240 $ 49,180 $ 47,546 $ 45,087
(a) Exelon retrospectively reclassified certain assets and liabilities with respect to option premiums into the mark-to-market net asset and liability accounts to conform to the current year presentation.
(b) Exelon retrospectively reclassified certain assets and liabilities in accordance with the applicable authoritative guidance for offsetting amounts related to qualifying derivative contracts.